
MACA Roadmap for Responding to Climate Change

")
A Climate Action Authority is the centerpiece of the MACA Roadmap for coordination across American society.
Click below to listen to MACA's audio guide on our Roadmap...
...and read the document:
Human activities have added more than 1.5 trillion metric tons of carbon dioxide to Earth’s atmosphere since the pre-industrial period, increasing its concentration from below 300 parts per million (ppm) to over 415 ppm today, and projected to surpass 1,000 ppm before 2100 without effective action. This anthropogenic change is primarily due to burning fossil fuels, which has resulted in the observable and ongoing climate change, including global temperature rise, warming oceans, melting polar ice, glacial retreat, sea level rise, and increased extreme-weather events. Ocean acidification is another significant global change attributed to increased carbon dioxide levels.
The United Nations Intergovernmental Panel on Climate Change (UN IPCC) assessments have detailed the wide-ranging damages from climate change and the far-reaching and unprecedented interventions required to limit them. In 2016, the UN Framework Convention on Climate Change (FCCC) including 196 of the world’s nations committed to reducing greenhouse gases through the Paris Agreement. It is imperative that these commitments be adhered to and enhanced in the next three decades to avoid irreversible damages to Earth’s natural cycles and ecosystems and to mitigate the threat to human societies.
The adverse impacts of anthropogenic climate change have significant social costs, which will increase dramatically if immediate action is not taken. These costs include economic damages from severe weather events and adverse health effects from pollutants generated by burning fossil fuels. Without immediate action, the projected costs are expected to become so severe as to threaten the security and well being of large numbers of people around the globe, ultimately leading to the loss of habitable land. A billion or more people are projected to be impacted in the next 50 years.
Immediate actions that are necessary to avoid the worst damages include termination of fossil fuel uses and their rapid replacement with carbon-neutral energy sources. Transition to renewable solar and wind energy which are now economically competitive, and electrification of building and industrial thermal energy systems are key priorities. In addition, improvements in energy efficiency and reductions in energy use are urgently needed. Concurrently, careful management of carbon sequestration assets such as coastal marshes, tropical forests and agricultural lands is essential. In order to achieve the aspirational goal of net-zero greenhouse gas emissions by 2050 or earlier, investments in research and development of all promising technologies are urgently needed. As capture technologies become economically viable, they might support reductions below net-zero in the future.
An aggressive timeline is essential to avoid the worst damages from climate change that will otherwise result in the coming decades of the 21st century. Such damages include increasingly more frequent and destructive weather events, food and water insecurity, and loss of habitats for large human populations. Urgent responses and actions are needed at the national, regional, and local levels as well as by institutional and individual leaders and citizens.
Climate Change
Climate change is the result of on-going and unprecedented human activities. The burning of fossil fuels, from industrialization around the world, especially since World War II, has driven climate change through the dramatic increase in heat absorbing greenhouse gases, especially carbon dioxide (Lindsey, 2020). Other greenhouse gases include methane and hydrofluorocarbons, which have much higher global warming potential than carbon dioxide and are therefore significant in much smaller concentrations. Prior to the industrial revolution, the concentration of carbon dioxide in our atmosphere cycled between 180-300 parts per million (ppm) for hundreds of thousands of years. Recently, however, atmospheric carbon dioxide has risen to over 400 ppm, reaching 415 ppm in 2020) (see Figure 1). One would have to go back millions of years in Earth’s history to find such a high level of carbon dioxide. The last time carbon dioxide levels were at similar levels was 3-5 million years ago before the evolution of modern humans, when the world was 2-3°C warmer and the sea level was 15-25 meters higher than today.
The rapid increase in carbon dioxide, as well as other greenhouse gases emitted by human activity, has driven the increase in the atmospheric temperature to about 1°C (or 1.8°F) above pre-industrial levels, resulting in observable changes to the Earth’s climate (NASA, 2021), such as warming oceans, melting polar ice, glacial retreat, sea level rise, extreme weather events, and ocean acidification. If we continue to emit carbon dioxide at the current rate, the atmospheric concentration of carbon dioxide could be double that of the pre-industrial era by 2050 and possibly surpass 1,000 PPM (0.1%) by late in the 21st century. Such a high concentration would likely result in a global temperature rise of greater than 4°C, which in turn would very likely cause catastrophic damages for Earth’s ecosystems and human society. Because significant destructive climatic changes are likely even if the temperature increases by only 1.5 - 2°C, many of the world’s scientists and governments are advocating for the world-wide goal of net-zero greenhouse gas emissions by 2050. Technologies needed for initiating this transition, including renewable solar and wind energy, are readily available. However, in addition to transitioning to renewable energy, further efforts will be required over the next few decades to reach net-zero (or carbon neutrality) emissions by mid-century to avoid the worst of the damages.

Figure 1. Atmospheric carbon dioxide concentration (parts per million, ppm) versus time from 500,000 years ago to present. Source: NOAA NCEI (Lindsey, 2020). Pre-industrial data are from Luthi et al. (Lüthi et al. 2008a; Lüthi et al. 2008b). See Figure 2 for temperature rise with CO2 spike in the modern era in the extreme right of this plot.

Figure 2. Both atmospheric carbon dioxide concentration (blue curve, on left in parts per million, ppm) and global mean temperature rise (backward-looking five year averages, red circles, on right in degrees Celsius) plotted versus time (Year) over the period 1950-2020. (GISTEMP Team, 2021). Note that this period corresponds to the steep rise in carbon dioxide concentration from ~300-400 ppm on the extreme right side of Figure 1.
Social Cost. The damages from climate change have significant costs that are borne across most economic sectors throughout the globe. Severe weather events, such as drought-induced forest fires, excessive flooding from hurricanes, and intense tornadoes, cause losses in the agricultural sector (FAO, 2017), and they destroy buildings and property, thereby resulting in losses in the industrial, commercial, and residential sectors. Weather-related economic damages from large disasters in the US are increasing as the severe weather events become more frequent (NOAA, 2020). Over the past 3 to 5 years, the average annual cost of large disasters exceeded $100 billion. Globally, disasters have more than tripled in number in the past 50 years (FAO, 2017). The increasing wildfires around the world, chronicled in a Science Brief report (Jones et al. 2020), are so concerning that headlines like Apocalypse Becomes the New Normal (Krugman, 2020) are becoming commonplace.
In addition to severe weather, the effects of climate change on global healthcare have been overwhelmingly negative (WHO, 2021), including increased insect-borne infectious disease and increased heat-related illness, as well as higher incidence of cardiovascular and respiratory diseases caused by pollutants from fossil fuel combustion. As significant as the costs are to wealthy nations, the projected impacts on developing countries are even more severe, including large-scale health impacts, food insecurity, water insecurity, economic insecurity, and the loss of habitable land, as described in a report from the United Nations Intergovernmental Panel on Climate Change (Core Writing Team IPCC, 2014).
The United Nations Intergovernmental Panel on Climate Change (IPCC) has conducted detailed studies and predicted far-reaching and unprecedented damages to the world’s environment and ecosystems. The IPCC has also provided the responses required to avoid this fate, the most important of which are reducing emissions of greenhouse gases immediately and preventing the loss of carbon sequestering lands. These steps will lead to slowing global warming, ensuring a more sustainable world with clear benefits to people and natural ecosystems. The longer the delay in action, the more difficult the problems will be to address in the future.
In 2014, the IPCC 5th Assessment Report (AR5) detailed the drivers of climate change and the needed responses to prevent the worst damages (Core Writing Team IPCC, 2014). The IPCC worked with many stakeholders and experts, including integrated assessment modelers, climate modelers, terrestrial ecosystem modelers and emission inventory experts to produce detailed narrative storylines and integrated scenarios. The key driving forces, including population, income, energy and land use, have been related to emissions, and conclusions have been drawn which provide guidance on these scenarios.
The IPCC AR5 scenarios for climate change are based on CO2 emissions and radiative forcing, the human-induced impact on the difference between sunlight absorbed by the Earth and radiated back to space. The scenarios are referred to as Representative Concentration Pathways or RCPs. The pathway with the highest radiative forcing, >8.5 W/m2 by 2100, is named RCP8.5. Two intermediate pathways in which radiative forcing is stabilized at 6 W/m2 and 4.5 W/m2 are RCP6.0 and RCP4.5, respectively. The pathway in which radiative forcing peaks at 3.1 W/m2 before 2100 and then declines is RCP2.6.
RCP8.5, the high-emission scenario, previously referred to as “business as usual”, is characterized by increasing greenhouse gas emissions over the 21st century and beyond and results in the highest CO2 concentration, with CO2e reaching 1,000 ppm or higher by 2100. Both RCP6.0 and RCP4.5 are scenarios that result in stabilization of total radiative forcing shortly after 2100 using a range of technologies for reducing greenhouse gas emissions. For RCP2.6, the scenario leading to the lowest greenhouse gas levels, CO2 concentration peaks mid-21st century followed by a decline. The upshot of this analysis is that only the RCP2.6 scenario likely results in global warming staying < 2°C above pre-industrial temperatures and avoids the worst damages from climate change.
Figure 3. International Panel on Climate Change (IPCC) Fifth Assessment Report (Core Writing Team IPCC, 2014) scenarios for GHG emissions. RCP8.5, Blue; RCP6.0, Black; RCP4.5, Red, RCP2.6, Green. (Source: van Vuuren et al. 2011, reproduced with permission from D. P. van Vuuren).

Table 1. Median temperature anomaly under different IPCC scenarios (Moss et al. 2010).
Detailed studies have compared the IPCC scenarios to past conditions present on the Earth. Past climates have been reconstructed to determine not only the eight glacial cycles (Augustin et al. 2004) over the past 800,000 years, but also fine-scale rhythmic variability from orbital variations over 66 million years (Westerhold et al. 2020). The success in capturing the natural climate variability supports the projection that the temperature at the end of this century will likely be the highest in at least 100,000 years. In addition, a new analysis of climate sensitivity (Sherwood et al. 2020) shows that it is extremely unlikely that the climate changes could be low enough to avoid substantial global temperature increase, in excess of 2°C warming under a high‐emission future scenario.
While the temperature changes might seem small, when put into proper geological context, the prospect of temperature rises in excess of 2oC are extremely alarming. Figure 4 provides such context with a plot of the changes in mean global temperature over the past 60 million years. In the figure, temperatures are plotted as the difference from historical (mid-20th century) values. The colored bars on the top portion of the figure from ~ 20 kyr to ~60 Myr before present show the climate states (Hothouse, Warmhouse, Coolhouse, and Icehouse) as identified by Westerhold et al. (Westerhold et al. 2020). Temperatures shown beyond 2018 are from predictions based on RCP 8.5 (brown), RCP 4.5 (light blue) and RCP 2.6 (purple) and are represented by curves with shaded areas between lower and upper limits of the predictions. For the past 3 million years, Earth's climate has been relatively cold, in an ‘Icehouse’ state characterized by alternating glacial and interglacial periods. Modern humans evolved during this time. However, anthropogenic greenhouse gas emissions are now driving the planet toward earlier stages in the planet’s evolution, called ‘Warmhouse’ and ‘Hothouse’ climate states, which have not been seen since the Eocene epoch ending about 34 million years ago. During the early Eocene, there were no polar ice caps, and average global temperatures were 9 to 14 °C higher than today. The IPCC projections for the high-emission scenario will potentially bring about mean global temperatures not seen in 50 million years.

Figure 4. Temperature trends over the past 65 million years (adapted from Burke et al. 2018, with permission from Proceedings of the National Academy of Sciences). Annotations are explained in the text.
A number of analyses of emissions data from 2000 to 2020 are troubling because annual emissions through 2020 are a very close match to the RCP8.5 emissions pathway (Schwalm et al. 2020), possibly portending extreme damages to the environment if future emissions cannot be brought under control. One recent study (Schwalm et al. 2020) also concluded that cumulative emissions through 2050 under RCP8.5 are closer to (but a bit over) what is expected than are the other RCPs. Although RCP8.5 assumed virtually no effort to reduce emissions while emission reduction policies and technologies are progressing rapidly, it very likely underestimated the impact of global warming feedbacks such as the melting of the Arctic sea ice, the thawing of the Arctic permafrost, increased forest fires, increased loss of soil carbon, etc.
The predicted damages from the IPCC AR5 RCP8.5 scenario include the following (Core Writing Team IPCC, 2014):
Risk of severe ill-health and disrupted livelihoods resulting from storm surges, sea level rise and coastal flooding; inland flooding in some urban regions; and periods of extreme heat.
Systemic risks due to extreme weather events leading to break-down of infrastructure networks and critical services.
Risk of flood and water insecurity and loss of rural livelihoods and income, particularly for poorer populations.
Risk of loss of ecosystems, biodiversity and ecosystem goods, functions and services.
These substantial risks, which span sectors and regions, are predicted with high confidence. In fact, many of these predictions are already coming true and climate change has quickly become an undeniable fact. A recent report from NASA and NOAA (NASA, 2020) found that the past five years each ranked as the five hottest on record globally, as did 19 of the past 20 years in this century.
There is a growing concern that global warming might cause abrupt (rather than gradual) changes to the Earth’s climate (Lenton et al. 2019), particularly if the additional warming caused by one climate feedback accelerates the emissions from other feedbacks. Although the changes that cause feedbacks to cross tipping points (Mahe, 2014) are not well understood, a recent article in Nature (Lenton et al. 2019) stated that the “evidence is mounting that these events could be more likely than was thought, have high impacts, and are interconnected across different biophysical systems, potentially committing the world to long-term irreversible changes”. An example of a possible tipping point would be the Amazon rainforest (Lovejoy & Nobre, 2019), after some amount of tree loss, turning into a savanna, releasing up to 86 billion metric tons of carbon dioxide (86 GTCO2). Other examples of tipping points have already occurred or are in progress: the Greenland ice sheet reached a tipping point 20 years ago (Palmer, 2020), the Thwaites Glacier in Antarctica is nearing a tipping point (Bowler, 2020) and could trigger an unstoppable 20-inch sea level rise (Slater et al. 2020). Substantial acceleration in global ocean circulation has occurred in the past few decades (Hu et al. 2020), intensified by surface winds and reaching kilometer depths. Record high temperatures of the oceans are being recorded (Cheng et al. 2020), which were the hottest ever in 2019, and before that in 2018, and before that in 2017. Recently, 2020 was reported to be tied as the warmest year on record (Hausfather, 2021).
There is no doubt that climate change has become an increasing threat to human health, water and food, economy, infrastructure, and security. Without immediate action to aggressively reduce emissions, a recent study (Mora et al. 2018) found that some ecosystems and societies will likely be regularly exposed to multiple concurrent climate hazards (e.g., "warming, heatwaves, precipitation, drought, floods, fires, storms, sea-level rise and changes in natural land cover and ocean chemistry"). The study estimated that by the year 2100, there will be from three to six simultaneous events, posing a broad threat via the intensification of the multiple vulnerabilities. Moreover, another study (Xu et al. 2020) found that a continuation of current emission trends over 50 years will likely result in 1-3 billion people being thrust outside the climate conditions under which our various global societies have developed and thrived over millennia. Therefore, it is likely that failure to take immediate action will result in mass migrations and large numbers of displaced people.
Human activities have resulted in emissions of an almost unimaginable amount of CO2 into the atmosphere - 1500 GT since 1751 (Ritchie & Roser 2020a) - resulting in the observed increase in global levels to over 400 ppm, with different countries responsible for emitting different amounts of greenhouse gases. The Union of Concerned Scientists (UCS 2020a) has analyzed data compiled by the International Energy Agency (IEA 2021) on CO2 emissions from the combustion of coal, natural gas, oil, and other fuels, including industrial waste and non-renewable municipal waste (Figure 5). Based on historic emissions, the US, Europe, and China have been the largest emitters. The US has emitted more CO2 than any other country to date, ~ 400 GT, which is 25% of the world total. The European Union, including the UK (EU-28), has emitted the second-most, ~350 GT, which amounts to 22% of the total. China has emitted the third-most, ~ 200 GT, or 13%. All the other countries, including Russia (6%), Japan (4%), and India (3%), together have emitted about 550 GT.

Figure 5. Historic carbon dioxide emissions by countries and regions as percent of world emissions (1751-2017). Sources: Union of Concerned Scientists (UCS, 2020a), Our World in Data (Ritchie & Roser, 2019; Ritchie & Roser, 2020a) and Global Carbon Project (Friedlingsetin et al. 2020).
Current emissions data by countries indicate some differences from historical emissions (IEA, 2021). China has surpassed the US and EU as the highest emitter, with the total share from the three top emitters changing from 60% historically to 41.5% in a recent report (Friedrich et al. 2020). Reduction in the share of global emissions from the top three emitters is primarily due to the increase in emissions from developing countries such as India, Brazil, Indonesia, Iran, and others. Nevertheless, the top emitters remain the most industrialized nations named in the historical data, with the 10 top nations responsible for two-thirds of GHG emissions. Rankings of highest emitters of total annual carbon dioxide can also be compared by the population of each country (per capita emissions). In this analysis, developed nations typically have higher carbon dioxide emissions per capita, while most developing countries lead in the growth rate of carbon dioxide emissions (Figure 6). These uneven contributions to the climate crisis are significant challenges for establishing equitable and acceptable solutions to global warming (UCS, 2020b).

Figure 6. CO2 emissions by country, organized in terms of total emissions and per-capita emissions from fossil fuel combustion. Higher total emissions countries are on the right with larger bubbles while the higher the per-capita emissions countries are higher on the chart. Data from 2018 was compiled by the International Energy Agency (IEA, 2021) and the Union of Concerned Scientists (UCS, 2020b).
Loss of tropical forests - critical natural carbon sinks - also poses significant challenges for establishing equitable solutions to the climate crisis. With increasing population, more forest lands have been cleared for agricultural use and contribute to increasing global emissions. As shown in Figure 7, we have lost over 25% of the world’s forests since industrialization, driven over recent decades by conversion of primary forests to agriculture (primarily pastureland for beef production), oilseed production (soybean and palm oil) and tree plantations (for paper and wood). Such intensive land use has been increasing GHG emissions while reducing the earth’s ability to absorb and sequester carbon dioxide. Together, these effects account for anthropogenic GHG emissions of about 12 GTCO2e each year globally.
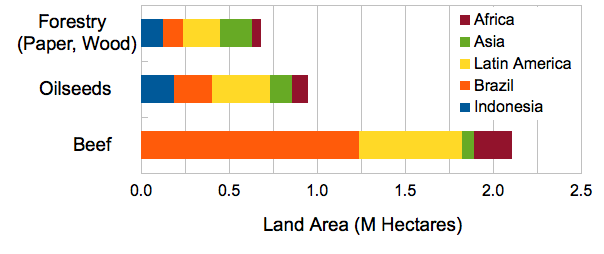
Figure 7. Beef and oilseed production represent the most important drivers of tropical deforestation (Ritchie & Roser, 2020b).
As primary forests in Europe and the US were mostly lost many decades ago, countries in Africa, Asia, and Latin America have become the focus of preventing the continued decline of forests. Given the importance of agriculture to these developing countries, preserving the existing tropical forests while meeting the needs of their populations is a significant challenge. This challenge presents an ongoing problem, with a reported 12% increase in deforestation (WRI, 2021) led by Brazil and the Democratic Republic of Congo in 2020. Europe and the US need to accept their share of the problem and help developing countries find solutions that balance the important competing factors of agriculture, biogeography (Sachs, 2001), and socio-economics.
Climate Justice. Climate change in emerging countries has elevated climate justice to the forefront (Agrawal, 2008). High-emitting economic segments of many emerging countries, for example, lithium extraction in South America (Barandiarán, 2019), are mainly for exports. These countries suffer high environmental hazards for relatively little economic gain (particularly for the lower income part of the population). On the other extreme, many developed countries (e.g., Europe and North America) outsourced their polluting activities to developing and emerging countries. When the carbon content of their imports is considered, their national emission statistics are not as clean as what their consumption patterns might suggest. There is now an international consensus about the need for a new approach of inclusive economic development in low-income and emerging countries, which calls for an active and supportive role of the developed world. Recent publications of the UN point out the importance of the next decade, with 2021 being a crucial year for this paradigm shift (UNEP, 2020b).
The United Nations has recognized the dangers of climate change and led the effort to limit greenhouse gas emissions through international agreements, the latest of which is the Paris Agreement. This agreement was approved by 196 countries (all but 2 of the world’s nations) at the end of the 2015 UN Framework Convention on Climate Change (UNFCCC) Conference of the Parties (COP-21) meeting in Paris. Although the value of limiting greenhouse gases to prevent temperatures from rising above 1.5oC was discussed, most of the nations supported limiting global warming to less than 2oC to prevent the worst of the damages. As a step toward meeting the Paris Agreement’s temperature increase goals, countries pledged non-binding GHG emission reduction plans, referred to as nationally determined contributions or NDCs (UNFCCC, 2021a and UNFCCC, 2021b)
Countries announced different levels of commitment in the NDCs, not necessarily reflecting their per capita emissions (see Figure 8). For example, the UK (and to a slightly lesser degree, EU) has an intermediate level of per capita emissions but has the highest commitment to emissions reduction. India has the lowest per capita level of emissions with an intermediate level of commitment to emissions reduction. China, Japan, Russia, and South Africa have intermediate levels of per capita emissions and low commitment to reducing their emissions. The US and Canada, and especially Australia, have high per capita levels of emissions and an intermediate level of commitment in reducing their emissions. These differences underscore a fundamental challenge to addressing global climate change - one that requires international leadership, especially from leading nations, such as the US and EU.
The US NDC, a pledge made to reduce US greenhouse gas emissions (EIA, 2020a) as part of the initial Paris Agreement, is to reduce 2005 emissions of 6.6 GTCO2e by 17% (to 5.5 GTCO2e) by 2020 and by 26-28% (to about 4.8 GTCO2e) by 2025 (Figure 9). Largely because of the closure of many coal-fired power plants since 2005, and the reduced economic activity in 2020 due to the coronavirus pandemic, US greenhouse gas emissions in 2020 will likely be close to the 2020 goal. Based on preliminary data for 2020, a recent study (Larsen et al. 2021) estimates that the US greenhouse gas emissions dropped by 10.3% last year, with reduction accelerated due to COVID-19. This extraordinary reduction is 21% below 2005 levels. This event is providing the opportunity to temporarily meet or exceed the US 2025 Paris Agreement target of 26-28% below 2005 levels.

Figure 8. Paris Agreement emission 2030 reduction targets (%) from NDCs versus per-capita emissions. Countries at the upper left hand corner are more ambitious and those that are less ambitious are at the lower right hand corner. Reproduced with permission from David Lunsford, MSCI (Lunsford, 2020).

Figure 9. United States NDC emissions targets for 2020 and 2025 in the Paris Agreement. (UNFCCC 2015).
Global carbon budgets for various temperature increases were established in the recent IPCC report (Rogelj et al. 2018) entitled “Mitigation Pathways Compatible with 1.5°C in the Context of Sustainable Development“. The carbon budgets were determined from probabilistic climate models run for a variety of input conditions and assumptions. The results were evaluated to assess the probability of various outcomes for those conditions and assumptions. From the results obtained for a given amount of total global emissions, the probability of not exceeding a specific temperature increase was estimated. In Figure 10, temperature increases are plotted against total global CO2 emissions from 2021-2100, after adjusting for 100 GTCO2 from natural emissions (i.e., 100 GTCO2 has been subtracted from the global carbon budget values on the abscissa). For example, for anthropogenic emissions of 1,200 GTCO2 the analysis suggests a 67% probability for having temperature increases of 2.2°C or lower, a 50% probability for having temperature increases of 1.9°C or lower, and 33% probability for having temperature increases of 1.7°C or lower. The conclusion of this analysis predicts an increase of over 4oC with the current rate of global emissions and the requirement of lowering total post-2020 global emissions to 1,200 GTCO2 to limit temperature rise to between 1.6oC and 2oC.

Figure 10. Global anthropogenic carbon emissions (for 2021-2100) and resulting temperature increase for three probabilities, assuming 100 GTCO2e from natural feedbacks. The plot was derived from IPCC data (Rogelj et al 2018).
Global Carbon Budgets and Emission Pathways. Global greenhouse gas emissions are currently at about 52 GTCO2e per year. The IPCC has estimated that the 2018-2100 global carbon budget for a 67% chance of not exceeding 1.5°C is 420 GTCO2. Because this carbon budget excludes additional earth system feedbacks (Lowe & Bernie, 2018) of about 100 GTCO2, and the annual CO2 emissions averaged around 42 GTCO2 for 2018-2020, the post-2020 anthropogenic carbon budget is about 194 GTCO2. Assuming that the CO2 emissions budget is 80% of the total GHG emissions budget, the post 2020 GHG accumulated emissions budget is about 242 GTCO2e for a 1.5oC temperature rise. Similarly, the IPCC estimated 1170 GTCO2 budget for a 2oC temperature rise, adjusted for feedbacks and converted to total GHG emissions, is about 1180 GTCO2e . Commitments to reduce emissions by defined amounts over a given timeframe correspond to levels of accumulated emissions that are added to the atmosphere before emissions are finally reduced to zero. Thus, a program of emissions reductions defines an emission pathway. The global carbon budget for a given temperature rise determines the removal burden that results from following a particular emission pathway. Significant accumulated CO2 emissions will need to be removed from the atmosphere to reach a target of 2°C or lower.
US Carbon Dioxide Removal Requirement. Meeting any temperature increase that is “well under 2°C” with a realistic greenhouse gas emissions pathway will require significant removal of carbon dioxide from the atmosphere. Therefore a “carbon dioxide removal requirement” needs to be calculated in addition to a carbon budget for the US. A carbon budget (and the corresponding CO2 removal requirement) for the US depends on four primary factors: (1) the temperature increase target, (2) the expected global emissions, (3) the expected US emissions, and (4) how the global carbon budget will be allocated to the various countries. Table 2 lists the expected US responsibility for carbon dioxide removal for three emission pathways and two temperature targets, assuming that the US should be responsible for removing 20% of global carbon dioxide. In Table 2, all emissions and carbon dioxide removal (CDR) amounts are in units of GTCO2e. The GHG emissions pathways assume that annual emissions will continue at the current annual rate until the Start Year and are then reduced linearly until reaching 20% of the initial annual emissions at the Net Zero Year. After the Net Zero Year the emissions drop in linear fashion to zero over 30 years. The Gross Emissions are the cumulative emissions from the present (2021) until thirty years after the Net Zero Year. The Net Emissions are the cumulative emissions that would have resulted if emissions had been reduced to zero in the Net Zero Year. The CDR is the difference between gross and net cumulative emissions (i.e., the amount of total carbon dioxide equivalent removal required to make global emissions net zero by 2100). The global carbon dioxide removal for a given temperature target is the sum of the CDR for a given pathway and the difference between the Net Emissions for that pathway and the budget for the temperature target.
Pathway #2 is the global goal for net zero in 2050. For pathway #2, the US cumulative emissions (116 GT) can be estimated by taking the Gross Emissions and multiplying by the current US annual emissions (5.5 GT) divided by the Global Annual Emissions (52 GT). A 20% share of the global removal responsibility would be 170 GT over several decades. As illustrated in Table 2, delay of the Net Zero Year has an appreciable cost in accumulated global emissions. For pathways with higher cumulative emissions and removal responsibilities, the annual removal requirement for the US could easily approach or even exceed the current US annual emissions.
Table 2. US carbon dioxide removal responsibilities for IPCC temperature targets and GHG emission pathways. Values for GHG, Net, CDR, Budget, Global, and US are all in GTCO2e (Source: CC Data Center, 2021a).
Building on Past Commitments. To avoid the worst damage from climate change, there is increasing agreement that the world must achieve net-zero carbon or carbon neutrality by 2050 or earlier. The EU and UK have already made national commitments toward this goal, including 55% cuts to greenhouse gases over the next decade, as a part of the response to the COVID-19 pandemic (European Commission, 2020a). In the remainder of the world, including the US, the net-zero carbon goal can be achieved through a similar process, including a combination of improvements in energy efficiency, reductions in energy demand, and conversion from fossil fuel use to electricity. Capturing and sequestering carbon dioxide from the atmosphere will ultimately be required for successfully achieving the full net zero carbon target.
The US Climate Alliance representing 24 states and 55% of the population has committed to the Paris Agreement goals, and the US Federal Government has just returned to this commitment. Even though the US net-zero goal is ambitious, by setting the appropriate goals and funding the necessary research and development, the national targets needed to meet the climate challenge are achievable. Leading states for climate commitments, including California, Washington, New York, Hawaii, New Jersey, Maryland, and others, have set an intermediate mandate of ~50% renewable energy or partial reduction of carbon emissions by 2030 (compared to 1990). The intermediate goals are achievable using current technologies and put us on the pathway to net-zero carbon by 2050.
One example of a state committing to these goals is California, which is reviewed in a recent Lawrence Livermore National Laboratory report (Baker et al. 2019). Although each state has its own unique circumstances, the broad outline of California's approach (an 80% reduction of greenhouse gases by mid-century and negative emissions starting within ten years and eventually amounting to 15-20% of current emissions) is applicable to most (if not all) states and for the US as a whole. However, as not all states have the same relative resources or emissions, the US Government may need to aid individual states on a case-by-case basis. Several proposals are available for achieving these goals at the state and national levels.
The methodology for reducing greenhouse gas emissions involves the following steps: (1) inventory of current greenhouse gas emissions; (2) establish emissions reduction targets; (3) develop specific plans for reducing greenhouse gas emissions. The longer term goal of negative emissions will be necessary to become fully carbon neutral, and to assist developing countries achieve their emissions reduction targets.
There are about 60 major sources of greenhouse gas emissions listed by the Energy Information Administration (EPA , 2020a; EPA, 2020b). These sources are generally grouped into five economic sectors based on where the emissions were generated (Figure 11, left): Residential and Commercial, Agriculture, Transportation, Industry, and Electricity Production. In this grouping, production of electricity is considered as a separate sector, and emissions generated at power plants are accounted for in the Electricity Production sector. For the US, in 2018 the relative percentages for the five sectors were 29% for transportation, 25% for electricity production, 24% for industrial uses, 12% for buildings, and 10% for agricultural activities.
These sources can also be grouped into four economic sectors based on where the energy was consumed (Figure 11, right): 38% for Industry, 23% for Residential and Commercial, 29% for Transportation, and 10% for Agriculture. In this grouping, the emissions attributable to Electricity Production are distributed among the four economic sectors. Emissions from a given activity within a sector include emissions from production of electricity that is consumed in that activity, as well emissions generated by use of fossil fuels for that activity. In the grouping based on where emissions are generated, Transportation and Electricity Production are the two largest sources of GHG emissions. When grouped based on where energy is consumed, Transportation and Industrial consumption are the largest sources of GHG emissions.

Figure. 11. Percent of US greenhouse gases from production (left) and consumption (right) by sector. Sources: US Energy Information Administration, Environmental Protection Agency (EPA, 2020a; CC Data Center, 2021b).
Table 3 lists the top 12 sources of greenhouse gas emissions that together are responsible for nearly 80% of all emissions. These different sources and sectors face different challenges and opportunities for emissions reductions, requiring an integrated and concerted approach to achieving the NDC and IPCC targets. Significantly, in the US electricity sector over the last 10 years, coal use has declined by about 35% while natural gas usage has increased about 60%. Nevertheless, coal remains the largest source of CO2 emissions in electricity production, with natural gas being the second highest contributor in the sector.
Table 3. Top sources of US greenhouse gas emissions in 2018. Source: Environmental Protection Agency (EPA, 2020b).
Carbon neutrality requires a commitment to establish a specific pathway to eliminate net greenhouse gas emissions by 2050. A simple way to create such a reduction pathway is to reduce emissions by 80% linearly from 2020 to 2050, which may be achieved through existing technologies. About 20% of greenhouse gases emissions will be more difficult to eliminate, and consequently, states like California are planning on emissions being cut by 80% by 2045 (Figure 12 and Table 4). Policies can then be created to reach intermediate goals of 50% or higher over decadal milestones. To reach the ultimate goal of carbon neutrality by 2050, research and development of carbon capture and sequestration, in addition to other technologies, will be necessary. Note that the emission pathway of Figure 12 includes carbon capture starting in 2025, with linear emissions reductions and targets similar to scenarios described in the discussion of Table 2.
Several US states are committing to substantial reduction in carbon emissions (see Table 4), led by California, New York and other states in the US Climate Alliance (US Climate Alliance, 2019). Hawaii, Virginia and Maryland are three states that have committed to 100% carbon-free electricity. Furthermore, electric power holding companies serving multiple states, such as Duke Energy (Duke Energy, 2020), are publicly reporting plans to achieve carbon neutrality. However, some states with high GDP contributions, such as Texas, Florida, and Georgia have not made any such commitments. Transitioning from this patchwork approach to a national plan will be more effective in achieving emissions reductions targets for the US.

Figure 12. California emission reduction trajectory. Source: LLNL (Baker et al. 2020)
Table 4. State carbon emissions reduction targets. See Appendix, State & Country Emission Reduction Targets & Mandates.
Table 5. National carbon emissions reduction targets. *LULUCF=Land Use, Land Use Change, and Forestry. BAU = “business as usual” scenario. Source: Climate Action Tracker (CAT, 2020; CAT, 2021), Copyright © 2009-2021 by Climate Analytics and NewClimate Institute. All rights reserved.
As part of the Paris Agreement, developed countries or unions, such as the US, EU, Japan, and Russia have pledged reductions of GHG emissions by 2030 (Table 5). Developing nations, such as China, India, and Brazil have pledged to reduce carbon intensity (i.e., GHG emissions per unit GDP), which will produce lower increases in GHG emissions than would occur in a high-emission scenario. However, the Paris NDCs do not achieve a pathway to limiting emissions sufficiently to prevent global warming of over 1.5-2oC, and more aggressive targets are necessary. If current national pledges to reduce greenhouse-gas emissions are implemented, which is not assured, they are likely to result in at least 3°C of global warming (Lenton et al. 2019). The next step in developing new national targets for emissions is scheduled for the UNFCCC meeting (COP-26) in Glasgow, Scotland, postponed to 2021 due to COVID-19.
The current national pledges are not sufficient to achieve an acceptable reduction in projected global warming and, if the pledged reductions are not increased, the consequences will be severe across the globe. As mentioned in “Accelerating Decarbonization of the US Energy System” (NASEM, 2021), a firm national commitment and demonstrable progress in the transition to net-zero emissions in the US would enhance its leadership in clean energy and climate mitigation. The report further states that the global demand for clean energy and climate mitigation solutions will reach trillions of dollars over the coming decades. Taking a leadership role in addressing global climate change therefore presents an opportunity for the US to strengthen its economy through comprehensive policies that bolster the manufacturing sector and promote the innovations needed to make the transition to net zero.
Primary Steps. The three primary ways to mitigate greenhouse gas emissions are: (1) replace energy from fossil fuels with carbon-free energy, (2) increase energy efficiency, and (3) reduce/alter consumption. Table 6 lists some of the actions that must be taken to reduce emissions and includes both an estimate of the emissions reductions for the US and how the reductions compare to the overall goal of an 80% reduction of 2020 emissions by 2050. Note that most emission reductions come by electrifying transportation, eliminating greenhouse gas emissions from the production of electricity, and the elimination of all fossil fuel use for heating in all sectors. The decision to replace fossil-fuel-powered energy production with carbon-free technologies is not only driven by cost, but also by state public utility commissions or local boards. Consequently, it is critical to bring a coordinated set of instruments to effect the transition to clean electricity. Such measures would include a combination of free-market principles, carbon pricing, changes to public utility regulations, and renewable energy systems. Furthermore, the combined actions listed in Table 6 still fall short of achieving net-zero, underscoring the need to further improve energy efficiencies and develop technologies to enable pathways to our reduction goals.
Table 6. An example of fossil fuel emission reductions that will almost meet an 80% reduction target (2019). Derived from 2019 US GHG emission data from EIA. (CC Data Center, 2021b; CC Data Center, 2021c).
Technology Development. Technology development is essential to achieving the overarching goal of carbon neutrality by 2050. Conversion from fossil fuels to renewable power sources will help progress towards the goal, but ultimate success will require some new technologies (NASEM, 2021). For example, a national high-voltage DC grid, an expanded infrastructure of charging stations, and a variety of energy storage devices, such as redox flow batteries will be needed. Furthermore, the development of enabling technologies for low-carbon synthetic fuel production can help the transition to carbon neutrality. Increased investment in technology development, as well as development of methods to validate the impact of the technology, will ensure future success.
Summary Recommendations
Central to our response to climate change is a pledge to reduce and eliminate fossil fuel use as rapidly as possible. We need an aggressive timeline to avoid the worst climate change damages, which will otherwise occur during the 21st century. In addition, we must adapt to the changes already underway and develop the technologies needed to achieve carbon-neutrality. The following are priorities and actions to effectively address the challenges of climate change:
Enact Net-zero or Carbon-neutral Legislation. “Carbon-neutral” means no net addition of greenhouse gases in the atmosphere. The sooner we can achieve this aspirational goal, the less damage we will experience in the future. Decisive leadership is required on national, international, and regional levels. In addition to decisive action from our elected leaders, collaboration of ordinary citizens and businesses is needed. We must commit to cut greenhouse gases by 50% by 2030 and become carbon neutral by 2050 through legislation and deed.
Replace Fossil Fuels with Carbon-free Energy. The pathway to the net-zero target begins by replacing power from fossil-fuel plants with renewable wind and solar power, and rapidly expanding off-shore wind power capability and solar photovoltaic capability. On-shore wind power and solar installations need to be expanded through incentivizing these technologies and eliminating subsidies to fossil fuel plants and fossil fuel producers. Construction of new coal-fired power should be banned in the US and worldwide. As energy production moves towards greener, renewable sources, the infrastructure supporting energy production and storage should be developed.
Electrify and Decarbonize Transportation Systems. Expand
and expedite the transition to electric-powered and zero-carbon-fuel
vehicles for all weight classes of on-road cars, trucks and buses. The
same technologies can be implemented in off-road, industrial and many
marine and heavy equipment applications. Any remaining non-electric
light rail should be electrified. Longer-haul rail can be electrified
and/or use low-carbon biofuels/zero-carbon fuels. In aviation,
development should be accelerated for hybrid and electric aircraft.
Longer-distance aircraft can migrate to lower-carbon
biofuels/zero-carbon fuels. Ready access to the appropriate vehicle
energy source will be critical to widespread adoption.
Improve Buildings and Communities. Conversion of all building energy systems to zero carbon is already economically available and should be aggressively implemented. All building energy systems must undergo full and efficient electrification and building codes need to include cradle-to-grave carbon emission guidelines. Financial incentives and public outreach should be used to encourage building owners to increase energy efficiency. City planning must take a holistic and long-term approach. Simulation software is available to help in designing living, walkable communities. For densely populated areas that often include commercial and industrial spaces, increased implementation of district energy is highly recommended.
Reform Land Management and Agricultural Practices. With increases in global population, careful management of land use and agricultural practices is essential. The most critical needs are to reduce conversion of tropical land for beef and oilseed production. Developed countries must provide resources and leadership to help offset the burdens to less-developed countries, as well as help provide solutions to land management and farming challenges. Potential solutions include improved practices that maintain soil health (regenerative agriculture) and provide sustainable agricultural efficiency, use of ecologically beneficial alternatives to industrial fertilizers, and managed grazing, as well as exploring new approaches that integrate trees and farming, such as agroforestry and silvopasture. Tropical countries relying primarily on agriculture for their economies will require assistance to employ and feed their populations and be assured of fair income from agricultural exports.
Achieving Net Zero: Carbon Capture and Sequestration. Annual negative emissions are required to achieve carbon neutrality by 2050. Some portion of the negative emissions capacity can be generated through improvements to management of agricultural and forest lands to increase their capacity for carbon capture, which will also improve air and water quality, thereby promoting better health. Significant advances are also needed for carbon capture and storage technology. R&D will be needed to select the best set of capture and storage technologies with the most promise for economies of scale, and ultimately the lowest cost for CO2 removal when implemented at scale.
Broad Goals. Given
the required scale and short timeline for effective climate action,
leadership at the federal level is essential. The stage has been set
with the Biden administration naming John Kerry, the lead US negotiator
in the Paris Agreement, as the Climate Envoy along with a strong climate team and return to climate-oriented policies.
Additional legislative action by the US Congress is required to
strengthen the goals and direct the appropriate agencies to monitor
progress towards the goals. The US climate response requires legislation
calling for net-zero emissions or carbon neutrality (“100% clean
economy”) by 2050, in line with the EU and other advanced nations. As
shown in the schematic in Figure 13, such legislation should direct
appropriate authorities, such as the Environmental Protection Agency
(EPA) to recommend interim goals and to monitor, evaluate, and report on
the progress of the US in achieving the national goal. Legislative
action should further direct members of the Cabinet to take actions in
coordination with the EPA using their existing authority as heads of
other federal agencies. The “100% Clean Economy Act” (H.R.5221, 2020) and the “Clean Economy Act” (S.3269, 2020),
both proposed in the 116th Congress, are respective house and senate
bills that set a national goal of net-zero greenhouse gas emissions by
2050.
")
Figure 13. Roadmap Graphic for Climate Action. Legislative measures support and direct decarbonizing the various sectors, as well as development of carbon capture and sequestration. Policy initiatives and directives drive increased climate action in the various sectors. In addition, short-term legislation establishes emissions goals and targets, technology investment priorities, infrastructure investments, incentives for green processes and products, and carbon disincentives. Longer term legislation guides and facilitates the continuation of the decarbonization processes.
Interim Goals. Interim goals, as well as the monitoring and evaluation of progress are critical to a successful plan. In order to chart a successful path to net-zero by 2050, a 50% reduction in greenhouse gas emission from 2010 levels by 2030 is required. The most appropriate mechanism for interim goals is through the UN IPCC NDCs, the next of which is scheduled for COP-26. We recommend more ambitious goals for the US than at Paris - approximately 7% per year in order to stay in line with the IPCC recommendations limiting global warming to less than 2 oC by 2100. The shorter-term goals are aimed at all greenhouse gas emissions and not just a particular sector (e.g., electricity generation). Short-term goals are critical to driving the necessary changes to our infrastructure and for accelerating the implementation of existing zero-emission technologies. An important effect of the intermediate-term targets is to help drive refinement of existing green technologies, as well as needed research and development of carbon capture and other negative emission technologies, to achieve long-term goals.
The
US carbon reduction targets need to be strengthened to achieve carbon
neutrality by 2050. The reduction in economic activity from COVID has
led to the reduction of emissions at an accelerated rate and provided an
opportunity to build needed infrastructure to enable accelerated
decarbonization of our economy. In addition, some states have
implemented more significant carbon reduction goals, which can serve as a
guide to more ambitious national targets expected to be announced at
global climate conferences, and will be instrumental for the US to
regain its leadership position in fighting climate change. The state
programs include carbon emission reduction targets, carbon-free
electricity targets, electric vehicle mandates, and prohibition of
natural gas hookups. See State & Country Emission Reduction Targets & Mandates for further details.
Sector-Specific Goals. In order to achieve the broad goals and targets, sector-specific targets to reduce greenhouse gas emission are required. For example the “Moving Towards a Safe Climate Act” (H.R.6171, 2020) directs the Department of Transportation to publish a plan to reduce greenhouse gas emissions from the transportation sector to 20% of the 2005 level of overall emissions in the US by 2040. Currently, the transportation sector accounts for 29% of overall emissions. However, the proposed emissions target is not low enough to support a 50% reduction of overall emissions from the transportation sector by 2030. More detailed sector-specific legislation with appropriate emission reduction targets is needed for each of the sectors (Transportation, Electricity Production, Residential and Commercial, Industry, and Agriculture). In addition to setting targets, the legislation should establish funding mechanisms to make transitions to currently available green technologies, as well as to support research and development of technology improvements.
In addition to addressing greenhouse gas emissions from power generation, buildings, transportation, and the manufacturing sectors, legislation must also address greenhouse gas emissions from agriculture and food production. The “Growing Climate Solutions Act” (S.3894, 2020; H.R.7393, 2020) encourages green agricultural practices and facilitates participation of farmers, ranchers, and private forest landowners in greenhouse gas credit markets. For these markets to become effective, development and implementation of agricultural practices to store more carbon in the soil (Bossio, 2020) is critical. For example, regenerative food systems (Pearson, 2007) have been proposed as a means to reduce greenhouse gas emissions associated with agriculture and food production, as well as to increase storage of carbon in soil. Methane emissions from the agriculture sector must also be addressed as part of a plan to get to net zero.
Carbon Fees, Permits, and Caps. Another important function of climate action legislation is establishing fees and incentives to respectively discourage greenhouse gas emission and encourage adoption of green technologies. A variety of instruments and mechanisms have been proposed, including fees, permits, caps, pricing, and accounting for GHG emission in the setting of rates. The use of economic measures (CPLC, 2017; Stiglitz, 2019) to reduce pollution is a well-established and accepted approach, and is expressed in the 1992 United Nations Conference on Environment and Development’s Rio Declaration, of which principle 16 is known as the “Polluter Pays” Principle” (UN, 1992). A carbon fee of at least $50 per ton of CO2 (Environmental Defense Fund, 2021) is necessary to capture the social cost of carbon. The appropriate fee is likely higher to account for all of the now widely accepted economic impacts.
State and Regional Fees and Mandates. Carbon
fees were introduced on the state and regional level in North America
as early as 2008, as exemplified by British Columbia’s Carbon Tax
program (Province of British Columbia, 2021). California joined with Quebec to enact a Western Climate Initiative (Climate Xchange, 2021) in 2012 and established an Emissions Trading Program (ARB, 2015)
in 2013. Since then, California has updated its legally enforceable
mandates (2018) to reduce emissions from electricity generation by 100%
in 2045. In 2009 the Northeastern states of Connecticut, Delaware,
Maine, Maryland, Massachusetts, New Hampshire, New York, Rhode Island,
and Vermont implemented the Regional Greenhouse Gas Initiative, known as
RGGI (RGGI, 2021). In
2012, New Jersey joined the RGGI, as did Virginia in 2020. The regional
approach exemplified by RGGI has been effective in reducing cap levels
on CO2 emissions from the power sector annually since 2014.
A similar approach in other US regions or preferably on a national
scale is essential to effectively limit emissions in order to advance
toward NDC and IPCC targets.
Federal Carbon Fees. More recently, carbon fees have been proposed at the federal level in bills introduced in the 116th Congress. The “American Opportunity Carbon Fee Act” (S.1128, 2020) proposes fees on fossil fuel products, fluorinated greenhouse gases, facilities that emit greenhouse gases, and associated emissions across the supply chain. It defines target attainment when greenhouse gas emissions drop to 20% of 2005 levels. The “Carbon Reduction and Tax Credit Act” (H.R.5457, 2020) proposes an excise tax based on the carbon content of fuel. The “Climate Action Rebate Act” (S.2284, 2020; H.R.4051, 2020) proposes a carbon fee for producers and importers of fossil fuels and fluorinated greenhouse gases. The emission targets stated in these bills are 0% greenhouse gas emissions by 2050 and 45% of 2017 levels by 2030. The bills further propose to deposit the fees into a climate action rebate fund to be distributed to low-income individuals and to be used for investment in infrastructure, energy innovation, and assistance for workers and communities to transition to a cleaner energy economy. The “Raise Wages, Cut Carbon Act” (H.R.3966, 2020) proposes similar fees, but suggests that the revenues be used to reduce Social Security taxes. The “SWAP Act” (H.R.4058, 2020) is similar to H.R.3966, but, in addition to using the revenues to reduce payroll taxes, it proposes that the revenue also be used for payments to Social Security beneficiaries and to a carbon trust fund for block grants to offset higher energy costs for low-income households, climate adaptation, energy efficiency, carbon sequestration, and research and development programs. The use of carbon fees in combination with rebates or trust funds to be distributed is often referred to as “price with a dividend” or “fee and dividend”.
Carbon Permits. Carbon permits have also been proposed in the 116th Congress. For example, the “Healthy Climate and Family Security Act” (S.940, 2020; H.R.1960, 2020) proposes to cap the emissions of greenhouse gases through a requirement for producers and importers of fuels to purchase carbon permits, the proceeds of which would be deposited in a “Healthy Climate Trust Fund” for distribution to the general public. Permits would also be issued to any person who has verifiably captured or sequestered carbon dioxide from combustion of fuel, and those permits could be traded. In order to achieve greenhouse gas reduction, the number of permits issued each year would decline. The proposed target for 2040 is a reduction in carbon emissions by 80% relative to 2005 levels.
Accounting for GHG Emissions in Setting Rates. Another mechanism to engage market forces to drive reductions of greenhouse gas emissions is to consider the environmental cost in pricing of goods and services. The “Energy Price Act” (H.R.5742, 2020) directs the Federal Energy Regulatory Commission (FERC) to ensure that electric utilities take greenhouse gas emissions into account when setting wholesale rates for the sale of electricity. It further encourages states and state commissions to incorporate the cost of greenhouse gas emissions into wholesale rates for electricity.
A Patchwork Approach is Inadequate. While
the patchwork of state and regional carbon fee programs has had a
positive impact in greenhouse gas reduction, addressing the climate
crisis and adhering to NDC and IPCC targets requires a national program
that engages all states and regions. In addition, limiting emissions
sufficiently to prevent global warming to 1.5oC will require immediate and effective international cooperation.
International Border Fees. Carbon border fees are an important tool for establishing incentives for other countries to implement programs to reduce greenhouse gas emissions. The 116th Congress’ “Energy Carbon Dividend Act” (H.R.763, 2020) proposes fees on producers or importers of carbon-bearing fuels or products derived from those carbon-bearing fuels, as well as carbon-intensive products, such as iron, steel, aluminum, cement, and glass, or products made from these materials. Border adjustments are also included in the “Healthy Climate and Family Act” (S.940, 2020). The European Roundtable on Climate Change and Sustainable Transition recently produced a whitepaper, “Border Carbon Adjustments in the EU: Issues and Options” (Marcu et al. 2020), and the World Economic Forum has reported that the EU is considering carbon border fees (WEF, 2020) These fees provide disincentives, as well as revenues that can be used to help global GHG reduction efforts.
Encouraging a Circular Economy. A common method to reduce waste is to use recyclable materials, recover them through waste recycling, and re-use them in production of new goods. A more systemic approach - the circular economy - can further reduce waste and improve sustainability of economic activities. Public policy can help drive adoption of circular economy principles, lower GHG emissions, and promote a sustainable economy. Certain EU countries and Japan have taken the lead in developing circular economies (European Commission, 2020b), which provide models for adoption by the US and other nations.
Comprehensive Federal Legislation is Needed. Of all the many recently proposed pieces of legislation to address climate change in the 116th Congress, only a single bill, the “Clean Economy Jobs and Innovation Act” (H.R.4447, 2020) has advanced to a vote. It passed in the House of Representatives, was received in the Senate (S.1183, 2020), and was referred to the Senate committee on Energy and Natural Resources. The stated purpose of the bill is to establish an energy storage and microgrid grant and technical assistance program. Included in the bill is a series of amendments to existing legislation, including acts dealing with building codes, training programs, public utilities, transportation and energy policy. This important bill also establishes rebate programs to encourage improved energy efficiency and grant programs to encourage research and development in renewable energy.
A comprehensive and effective array of Federal legislation must include the following key components:
Setting Broad Goals and Targets (G&T)
Establishing Authority of Government Agencies and Directors (EA)
Setting Sector-Specific Targets and Timelines (SST)
Establishing Financial Incentives and Funding (FIF)
Establishing Research and Development Grants (R&D)
Facilitating Large-Scale Implementation (LSI)
Updating Trade Agreements (TA)
In addition, committees and caucuses focused on the climate crisis can craft policy recommendations and coordinate the legislative action. The different purposes of legislation to address climate change, along with key components, the affected sectors, relevant congressional committees, and some example bills are shown in Table 7. Movement on such legislative initiatives at the national level is imperative for the US to stay within its NDC and IPCC targets and to regain its leadership role in climate actions. It must also establish mechanisms, such as through active participation in UN COP-26 and other international conferences to ensure that other countries establish and meet emissions targets to achieve the 1.5°C global warming threshold.
Federal legislation must set the national goal for climate action and empower the appropriate federal agencies to take the necessary measures to ensure progress towards the goal. Furthermore, it must direct federal agencies to take action in a manner that protects public health and safety and distributes the associated burdens and opportunities appropriately among demographic and economic groups. Plans must be developed to manage extreme weather events, such as in expanding flood zones and addressing health concerns from increased temperatures, ozone, asthma, allergies, and infectious diseases. Management of low-lying lands and vulnerable communities, which are likely to suffer the worst effects of flooding and storms, must be prioritized.
Table 7. Federal climate legislation. Note: Examples of legislation for a given purpose do not necessarily have all the components mentioned in the second column of the table.
A search of current net-zero legislative proposals can be found here: Legislative Search Results.
An Ambitious Plan is Essential. An ambitious plan to replace fossil fuels with renewable carbon-free energy is essential to stay on the pathway to Paris Agreement NDCs and limit climate change. The US should take a lead in this transformation from both a national perspective of “Building Back Better” after COVID and from the international perspective of providing renewed global leadership on climate. These objectives can best be accomplished with an aggressive timeline through a combination of technology, legislation and education. The COP-26 meeting in late 2021 is the appropriate conference for increasing nationally determined commitments, which for the US should be at least 50% reduction in greenhouse gases from 2005 levels by 2030, a critical step to achieve net-zero emissions by 2050.
Carbon-Free Electricity Enables GHG Reductions in Other Sectors. Replacing
fossil fuels in generating electricity is a key requirement for making
transportation systems carbon-free. While electric vehicles have no
tailpipe emissions, exchanging the burning of gasoline for electric
power made by burning fossil fuels does not provide the needed GHG
emissions reductions. Furthermore, eliminating fossil fuels from power
generation is a critical requirement for reducing the GHG emissions
associated with industrial, commercial, and residential buildings. It is
imperative that all subsidies to the fossil fuel industry end and be
replaced by incentives for renewables and directives to expand
carbon-free energy infrastructure.
Phase Out Coal. One of the most promising ways to accelerate this transformation is by phasing out coal-fired power plants. US energy-related CO2 emissions from coal have already declined by more than 50% from 2007 to 2019, and continuation of this trend for rapid coal elimination is essential with about 75% needing to shut by 2030 to stay below 1.5oC (IPCC 2018). Phasing out coal will reduce CO2 emissions by more than 1 billion metric tons annually (EIA, 2020b), and based on recent analysis (Gimon et al. 2019), local wind and solar could replace two thirds of the US coal fleet with long-term savings to customers. Moreover, the impact of coal is a significant concern internationally, with coal-fired electricity generation continuing to grow and accounting for a substantial portion of global CO2 emissions world-wide (IEA, 2019). Retiring coal-fired electric generation is both environmentally and economically positive (Gimon et al. 2019) in almost all circumstances, and should be accelerated around the world. Bringing additional governmental support to halt new coal plant construction and to close existing coal plants as soon as possible, regardless of their initially perceived full economic life, will be important for accelerating this transition and achieving a 1.5oC climate solution.
Immediate Reduction with Affordable Technology. Replacement
of fossil fuels by renewable energy, including renewable on-shore and
off-shore wind and solar power, combined with intensified
electrification, is the most technologically and economically sound way
to immediately reduce emissions with the ultimate goal of net-zero
emissions (Jacobson, 2020) by 2050. A study entitled “Global energy transformation: A roadmap to 2050” from the International Renewable Energy Agency (IRENA, 2019)
highlights immediately deployable and cost-effective options for the US
and other countries to fulfill Paris Agreement NDCs climate commitments
and to limit the rise of global temperatures. The recent report from
the National Academies (NASEM, 2021)
details the transformation to clean electric power in the US. Such an
energy transformation will also reduce costs of energy production and
bring significant socio-economic benefits to society, including
increased economic growth, job creation and overall welfare gains.
Because of equipment life cycles - from power plant facilities, to grid
components, to vehicles and appliances - it is critical to stop the
construction and sale of high-GHG-emission facilities and equipment as
we begin the transition to low- and zero-emission technologies.
Clean Energy Economics. For new facilities, the projected levelized cost of generating electricity from renewables (Lazard, 2020) is now less than the levelized cost of new facilities generating electricity from coal, natural gas and nuclear fuel. The economic competitiveness of renewables is illustrated in Figure 14, which shows the trends over the past decade for levelized cost of electricity (LCOE) from various power sources. As described in “Renewable Power Generation Costs In 2019” (IRENA, 2020) the determinants of LCOE are total installed costs, lifetime capacity factor, operation and maintenance costs, the economic lifetime of the project, and the cost of capital. In Figure 14, the power sources are sorted by lowest cost per kWh for 2019, with increasing current cost from left to right.
For new facilities, the projected levelized cost of generating electricity from renewables (Lazard, 2020) is now less than the levelized cost of new facilities generating electricity from coal, natural gas and nuclear power. In some locations worldwide, the projected levelized cost of new wind and solar installations is already less than the marginal cost of operating existing coal and nuclear power plants (Lazard, 2020).
")
Figure 14. Global LCOEs from newly commissioned utility-scale renewable power generation technologies, 2010-2019. Renewable energy has become an increasingly competitive way to meet new power generation needs (Replotted from Lazard Levelized Cost of Energy Comparison, Historical Utility-Scale Generation Comparison) (Ray & Douglas, 2020, © Lazard, 2020, all rights reserved). Note: CSP denotes concentrated solar power (as compared to Solar PV, which denotes solar photovoltaics).
Continuing Trend. The worldwide trend of lower levelized cost for solar and wind is expected to continue through the 2020’s according to multiple reports. An example of how lower costs have affected decisions by utilities is an announcement in 2019 by the Los Angeles Department of Water and Power, or LADWP (Los Angeles Times, 2019). A multi-year contract allows LADWP to buy electricity at an exceptionally low price of less than $0.035 per kWh from a new solar facility to be constructed in the Mojave Desert. The facility also will include energy storage to extend the time during the day when the facility can provide electricity to the grid. Although LADWP customers will pay additional costs for transmission and distribution, the low generation cost suggests customers need not pay more for electricity generated from renewables, even in areas not as ideal for solar as the Mojave Desert.
Wind-Generated Electricity Costs are Declining. By 2030 wind-powered electricity costs are expected to decline 50% compared to 2017. The ever-lower cost for new solar and wind could put pressure on utilities to replace existing fossil fuel plants before the end of their useful life. An issue for regulators in the US, and likely other countries as well, is that of who should absorb the decommissioning costs if a fossil-fuel-powered generation plant is taken out of service, whether decommissioned before 2050 because of economics or in 2050 to meet a GHG mandate -- utility rate payers, utility shareholders or both? Policy directives, e.g., preventing utilities from building fossil-fuel-based power plants as soon as possible, would allow sufficient time to recoup investments in existing plants. For plants that are decommissioned before the end of their useful life, mechanisms can be established to roll some cost into the price/kWh of electricity, with appropriate limits to prevent undue gain from the rate increase. Another issue facing regulators in the coming decade is whether to allow more micro-grids within a utility’s service area, especially micro-grids based on lower-cost solar installations. Possible ways to address the challenges posed include: 1) mechanisms to help predict generating requirements, such as restrictions on net metering, and 2) mechanisms to allow utilities to earn return on investment by funding the cost and installation of solar panels for the microgrids and collecting a monthly service charge.
Net Positive Effects on Employment. Proposals for rapid transition of primary energy sources from fossil fuels to zero-carbon sources are frequently cast as ones that will reduce employment and slow economic growth. Such concerns are often cited in regions where coal mining and/or oil extraction are significant parts of the local economy. Some localized job dislocation might occur as a result of the transition to zero carbon. Efforts must be made to provide alternative local jobs associated with the transition and with maintaining the zero-carbon energy industry. A recent study (NASEM, 2021) has recommended additional workforce retraining, and based on experience when other technologies have been replaced, the US should experience job growth with the transition to renewable energy.
Pollution and Climate Change Have Associated Costs. Numerous studies suggest that transitioning to renewables will reduce costs associated with air and water pollution caused by burning fossil fuels. One of many studies available is from the Union of Concerned Scientists (UCS, 2021). There are also studies citing costs for the impact of rising sea levels on coastal areas and cities worldwide. One such study was published by the EPA (EPA, 2017). Many other studies are available on the impact of sea level rise, as well as possible negative impact on agricultural production and food supply.
Subsidies and Resisting Change. There has been controversy in the US about the tax benefits and subsidies for renewables, and arguments against such incentives fail to acknowledge the history of subsidies and tax benefits for the fossil fuel industry. While some companies in the fossil-fuel industry have been resisting the transition to renewables, several major oil companies – BP (BP, 2021), Shell (Shell, 2020), and ExxonMobil (ExxonMobil, 2021) have begun revamping business plans to incorporate more revenue from renewables. Eliminating subsidies for fossil fuels - especially phasing out the depletion allowance - would accelerate the transition to renewables.
Worker Safety. The coal industry represents considerable healthcare challenges for its workers. At 10-11 fatalities per 100,000 workers, coal mining jobs (CDC, 2021) have above-average work-related fatality rates, in addition to posing long-term health risks for workers (black lung disease and silicosis). Furthermore, the operation of coal mines has an adverse environmental impact on the surrounding community, and the burning of coal in power plants nationwide contributes to air pollution that has adverse health effects on humans. Officials from coal mining regions would better serve their constituencies, as well as the general population, by helping their regional economies transition from coal mining to renewables or other industries that are important for a green economy. An important part of the responsible transition to clean energy is ensuring that no particular group suffers significant economic harm. Creating job opportunities where fossil fuel jobs are lost is a necessary part of the transition plan, and those jobs can be in the manufacture and assembly of renewable energy systems. Training programs should be an integral part of the transition plan to help workers move to green energy jobs from coal mining, fracking, and other fossil fuel jobs. Abandoned coal mines and depleted oil and gas fields have been considered as possible sites for CO2 sequestration. Maintaining and operating such sites would draw on skill sets found in the fossil fuel industry.
Ample Capacity from Renewables. In addition, it is asserted that the fossil fuel industry is needed to provide the power for converting the transportation sector to electric vehicles. As the power generating capacity from renewables is increased, more jobs will be created, and the demand from transitioning the transportation sector to electric vehicles can be met without the need to maintain our fossil fuel consumption. Between solar power (Deng et al. 2015) and wind power (CSS, 2020) generation, there is ample capacity that can be steadily added. Studies have shown, e.g. that increases in US electricity demand from light duty electric vehicles will likely be from 570 to 1140 TWh (Fox-Penner et al. 2018). However, the anticipated growth in the electric sector capacity will be able to accommodate electric vehicles, and transport electrification should therefore remain a cornerstone of decarbonization policy.
What about China? Yet another justification for maintaining our use of fossil fuels is that China continues to build coal-fired power plants. China’s increased use of coal-fired power plants is tempered by the government’s interest in reducing air pollution, which can be quite severe. In 2008, factories and power plants had to shut down to make the air quality acceptable for the Beijing Olympics (Li, 2008). Furthermore, if the US adds significant border fees to any products made in China that account for China’s failure to reduce their use of fossil fuels, more manufacturing jobs will return to the US, and China will see its manufacturing business decline, unless it acts to reduce its fossil fuel consumption. Furthermore, US global leadership on this issue is essential and can create opportunities to export renewable energy technologies to other countries.
Similar
distraction from attention and focus on US efforts is attempted by
discussion of the EU’s plans, casting doubt on the EU’s ability to meet
emission reduction goals, given the same kinds of challenges that
reduction efforts face in the US. As in the US, the EU has a choice of
paths to a zero-emission future. The optimal path, enabled by
appropriate interventions, could achieve net-zero emissions at net-zero
cost (McKinsey, 2020).
US global leadership can help other countries and international unions
find the right paths, and it can provide economic opportunity for US
companies engaged in the renewable energy and related markets.
Transportation systems account for roughly 28% of all GHG emissions (EPA, 2020c) in the US (1.9 GT of more than 6.6 GT total GHG emissions in 2018). Transitioning the entire fleet of existing transportation vehicles to zero-tailpipe emissions will be an effective albeit gradual way to substantially reduce greenhouse gas emissions. The average age of light-duty cars and trucks (Bureau of Transportation Statistics, 2021) is approaching 12 years and the useful life can approach 20 years. The average annual miles traveled for various vehicle categories are shown in Figure 15. According to Department of Energy (Alternative Fuels Data Center, 2020) data, miles travelled for the heaviest trucks, which have the highest GHG emissions per mile, average 62,800 miles per year compared to 11,500 miles per year for lighter-duty cars/trucks. Given the long life of vehicles these assets must be replaced with net-zero alternatives at the end of their life cycle.

Figure 15. Miles travelled per year by general category of vehicle. Emissions per mile increase with the size of the vehicle (Alternative Fuels Data Center, 2020).
The useful life of many off-road vehicles, marine craft (USDA Agricultural Marketing Service, 2006) and aircraft (Bureau of Transportation Statistics 2021) can exceed 20 years. Emissions regulations for these vehicles have been less stringent than on-road cars and trucks.
To achieve zero-tailpipe emissions by 2050 will require that all vehicles become electric or use zero-carbon fuel. We believe existing or soon-to-be introduced electric-power technology can be used to achieve zero-tailpipe emissions by 2050. Virtually all major light-duty car/truck and heavier truck/bus manufacturers offer or soon will offer models with zero-tailpipe emissions - see CALSTART’s listing of electric models by manufacturer (CALSTART, 2020). Given currently available technology, most electric trucks will be used in regional applications with limited daily range. Some applications will necessarily include “opportunity charging” during the day. Over time, upgrades to batteries, capacitors and/or fuel cells will extend the range between charges and broaden use to longer-haul, over-the-road applications. As shown in Figure 16, increases in energy density are projected out to 2035 for a variety of electrochemical devices with solid state Li-metal anode batteries being the most promising. Continued support for research and development into high density batteries will lower cost and improve performance in the transition to electric vehicles.
")
Figure 16. The history, current state, and development of Li-ion batteries (adapted with permission from (Lu et al. 2019). Data for high-density battery technology are from Contemporary Amperex Technology (CATL), Lishen, Samsung SDI, LG Chem, SK Innovation (SKI), and Gotion. Data for high-density battery technology under development are for CATL, Lishen, SDI, SKI, and LG Chem. Programs in the US, Japan, and the People’s Republic of China (PRC) have an energy density goal of 500 Wh/kg.
Technology for recharging electric vehicles is well tested. Availability of charging stations for recharging electric vehicles (DOE Office of Energy Efficiency, 2021), especially rapid charge locations, needs to be expanded throughout the US. Introduction of other types of recharging – inductive, e.g. – would make recharging more convenient but is not required to achieve the 2050 target.
Fuel Cells. Using fuel cells can extend the range of all electric vehicles. Fuel cells are ideally suited for heavier trucks. Incorporating fuel cells in heavier trucks would reduce the size of the battery pack required and result in extended range compared to using 100% batteries.
Most fuel cells use hydrogen as feedstock. Some work is being done on developing fuel cells with feedstock of common liquids that could be easily distributed to appropriate locations. Using these liquids would reduce the need for distribution of hydrogen to more remote areas. Additional government funding for development of fuel cells would help increase the likelihood of achieving the 2050 zero-emission target. Versions of fuel cells using common-liquid feedstock could provide electricity in remote areas or provide supplemental power to localized grids.
Lower-Carbon Fuels. In addition to electric-power, increased use of green hydrogen (Bartlett & Krupnick, 2020) could be used to eliminate tailpipe emissions, especially for larger, over-the-road trucks. While the infrastructure for recharging and/or for production and delivery of hydrogen is being expanded, increased use of much lower-carbon 100% biodiesel and similar fuels could immediately reduce emissions on existing diesel trucks. Based on data collected during pilot programs, municipal fleets have experienced a reduction in GHG emissions of 75% (REGI, 2021) using 100% biodiesel, even in very cold weather.
Trucks. Initial cost for electric-powered trucks, and cars, has been an issue. While the price premium for electric cars has declined with higher volume, the combination of low volume and the size of the battery pack in trucks has resulted in a substantial premium over comparable diesel trucks. Even though operating costs and total life-cycle costs are projected to be lower for electric than diesel, some incentives are likely to be needed to accelerate the purchase rate. An option for lowering the initial purchase price of electric vehicles is to separate the cost and/or separate the funding of the battery pack. The cost of the pack is the equivalent of “pre-paying” a substantial portion of several years worth of fuel.
For heavier marine craft and/or aircraft, much of the technology and/or liquid fuels for heavier trucks should be transferable with limited product development required.
A non-technology issue is to ensure all internal-combustion engine vehicles are off the road by 2050, save very low-mileage antique vehicles. Removing vehicles from use can be accomplished through a buy-back program.
Buses. Electric transit buses are currently available. Periodic stops can be used for rapid “opportunity charging” that extends range and operating time. The equipment for such rapid recharging is currently available. Proterra (Proterra, 2021) is an example of a company that can help municipalities select: (i) electric-powered buses; (ii) number and type of charging stations to match routes: (iii) options for financing. The American Public Transit Association (APTA) has a number of white papers and technical information about how to transition various components of the transit fleet to zero-emission/low-emission: (American Public Transportation Association, 2021).
Like heavier-duty trucks, mass transit vehicles have a long useful life. To achieve immediate reductions in GHG emissions in transit buses, relatively low-cost equipment can be added to the diesel engine to allow use of 100% biodiesel. Using 100% biodiesel transit buses should realize a similar 75% reduction in GHG emissions (REGI, 2021).
Rail. Electric fixed-rail transit has long been available using a 3rd rail or pantograph. Availability of battery electric trains is limited but could increase with use of fuel cells for recharging the battery pack. Diesel locomotives currently used for mass transit can be converted to use biodiesel for immediate reduction in GHG emissions. Most commuter rail has terminal points where complete battery recharging or refueling can be completed.
Charging Infrastructure. Along with increasing zero-emissions vehicular use, planning for the infrastructure required to meet the new recharging and refueling needs is essential. While battery-powered electric vehicles (EV) require a longer recharging time than refueling with gasoline, the user is not restricted to a “public refueling” location as with gasoline. Recharging cars can be done wherever there is an electric outlet. For example, users can recharge vehicles overnight using a 120V outlet at home or in an urban parking garage. The current public infrastructure for fast charging will likely prove suboptimal when the number of electric vehicles rapidly expands. Because of the lead development time and zoning restrictions in many locations, we recommend urban planners, utility planners and design engineers work toward a multi-vehicle charger with a smaller footprint that can be distributed across communities. For hydrogen and biodiesel fueled vehicles, current gasoline infrastructure can be upgraded and utilized.
Buildings and communities (10 GTCO2e globally in 2020) present a good opportunity to reduce GHG emissions (UNEP, 2020a). Currently, operating the existing stock of buildings generates 38% of energy related carbon emissions while building new ones incur 10% of upfront carbon cost in the materials and processes used and 35% of energy used globally. Moreover, annual progress in decarbonization in this sector was halved from 2016 to 2020. Planning for and curbing the effects of climate change is even more critical for flood-prone communities. For example 300,000 US coastal homes, with a collective market value of about $118 billion, are at risk of chronic inundation in 2045 (UCS, 2018). Flood risks around the world (WRI, 2020) will affect upwards of 15 million people and $177 billion in urban property will be impacted annually by coastal flooding by 2030, while more than 130 million people and $535 billion in urban property will be impacted annually due to riverine flooding. The required infrastructure investments to mitigate the impacts of flooding are social costs of climate change that will increase dramatically if action is not taken to limit climate change.
Use Simulation-Driven Decision Making. Regional planners and policy makers should harness computing power to help plan, zone, and design at a more holistic level for a longer time horizon. Open-source program, CityScope (MIT Media Lab, 2021), allows for the incorporation of behavioral patterns into simulations to help solve spatial and urban design challenges. For example, it can help increase walkability in a community and lower traffic related carbon emissions, and optimize the placement of electric vehicle chargers (Fredriksson et al. 2019). Urban Modeling Interface, or UMI (Reihnhart et al. 2013) allows planners to simulate and quantify (Alonso et al. 2018) the impact of various measures, such as green walls (Mulhern, 2020), green roofs, better insulation, and adding street level vegetation (Lan et al. 2020). Similarly, architects can use UMI to guide their designs and balance the operational and embodied carbon of new buildings. Together, such simulations assist in the maximizing resource allocation and optimally reduce carbon emission.
Modernize Energy Production, Storage, and Distribution. Industrial processes, together with electricity production, currently account for about half of US annual GHG emissions. These emissions result from processes, such as fossil fuel combustion for heat and energy, non-energy use of fossil fuels, and chemical processes used in iron, steel, and cement production. It is important to set carbon intensity reduction guidelines to encourage these sectors to control such emissions.
Instead of relying on fossil fuel for energy, electrification and renewable power hold the key to markedly reducing our carbon footprint. Given that power generation from renewables, such as wind and solar, tends to be intermittent and our present-day electricity demand is more variable, smart grids powered by AI (Rifkin, 2021) are needed to connect, communicate, and optimize the distribution of power in communities. Consequently, each building has the potential to become a micro renewable power producer. Also, renewable power storage systems, e.g., green hydrogen carriers (e.g., ammonia, formic acid, etc.), solid state batteries, or pumped storage hydroelectricity, should be utilized to solve the intermittency issue (Fares, 2015) and enable carbon emission reduction via electrification. Overhauling the transmission and storage system across the entire nation will require time and needs to be commenced as soon as possible. Meanwhile, blending green hydrogen could quickly reduce the carbon content of natural gas, which currently accounts for a third of US total primary energy consumption.
Increase District Energy Usage. District energy systems hold the potential to significantly reduce operational emissions of the existing building stock. Together, heating and cooling homes produce 441 MT CO2 annually in the US. Centralized heat production is more efficient than operating individual furnaces, boilers, and electric baseboards. It also provides the opportunity to utilize waste heat (Data Center Frontier, 2020), capture emissions from a point source, and is well-suited for industrial zones and densely populated areas. The US already has installed capacity to serve 5.5 billion heating gross square footage (EIA, 2018). District energy can also be used to serve commercial, institutional, and hospitality spaces, as these tend to be clustered together. As power generation in the US moves away from fossil fuels, district energy systems that are powered by cogeneration plants should become less carbon intensive as well. However, cogeneration plants will never be zero carbon, hence other electrification approaches must be used. The use of geothermal wells (Federation of Canadian Municipalities, 2021), waste-to-energy systems (BC Climate Action Toolkit, 2021), and other renewable energy sources (Tschopp et al. 2020) and use of techniques such as heat pumps must occur to further reduce carbon emissions from heat and hot water requirements.
Thermal Micro District Building Energy. A new form of ‘micro-district’ building thermal systems (Schulman, 2020) based on 2-pipe “ambient loop” heat pump technologies has proven exceptionally cost effective. Most net-zero-energy buildings such as new secondary schools (Torcellini et al. 2020) are being built with these systems and are even showing profits (Madson, 2021). Leading organizations such as ASHRAE (Spitler & Southard, 2014) and NREL (Torcellini et al. 2020) have studied and reported on these systems strongly confirming their efficacy and economic benefits. Conversion of whole campus HVAC systems has already occurred (University of Wisconsin, 2014; Colorado Mesa University, 2021) with more underway and proposed. While these new systems are well proven and cost effective, significant barriers to their rapid deployment exist, especially in the form of Uninformed Engineers.
Step Up Energy Efficiency Incentives. With about 80% of the existing housing stock being single-family dwelling units, steeper carbon tax in conjunction with more attractive, tiered financial incentives or assistance could be offered to quickly encourage individuals to step up their energy efficiency. A better insulated home will reduce heating and cooling needs which account for about 35% - 50% of energy needs. Simply upgrading from old equipment to new ENERGY STAR-qualified furnaces or boilers could mean increasing the fuel utilization efficiency from a 56% - 70% range to 99%. As an interim strategy, such upgrades can help reduce emissions. Converting to electric powered heat as electricity production becomes fully decarbonized will provide a net-zero option. Furthermore, converting antiquated heating equipment (Mass.gov, 2021) to heat pumps could reduce operational carbon emissions even more, with increases in coefficients of performance from 250% (low end air source heat pumps) to 550% (geothermal heat pumps). Similarly, for households in warmer or tropical climates, new higher efficiency air-conditioning units without ozone-damaging refrigerants should replace older units; cooling units that harness solar thermal technology (Lim, 2017) could further reduce carbon emissions and avoid the urban heat island effect. Annual net-zero-energy (DOE Website, 2021) and zero-carbon (New Buildings Institute, 2019) building approaches are becoming well proven and more widely known, and they should be increasingly adopted by all parties.
Lower Embodied Carbon in Construction. Every new construction or renovation has the potential to incur upfront carbon costs in the choice of materials used and/or the fuel to power onsite generators. At the same time, it presents the opportunity to employ innovative technologies and sequester carbon dioxide. Attaching a carbon intensity score that accounts for life-cycle GHG emissions to a material, as shown in Figure 17, will help guide choices toward materials and fuels with smaller carbon footprints. For example, conventional concrete has a high carbon footprint (Guardian, 2019). Green concrete, on the other hand, uses carbon sequestering technologies, such as CarbonCure (CarbonCure, 2021) and Carbicrete (Carbicrete, 2018), and provides a path to reduce embodied carbon. However, materials produced using these new technologies might cost more than conventional options and construction regulations are needed to encourage their use.

Figure 17. Cradle-to-Grave GHG Emissions (Modified from C40 Knowledge Hub, 2021 using icons designed by macrovector / Freepik; Zizzo et al. 2017).
Policy Implications. Building codes should include increasingly stringent requirements on life cycle GHG emissions (Figure 17). With explicit caps on embodied carbon by building type, the updated building codes would also encourage the use of the "passive home standard" for all residential construction. Building permits on new construction or major renovations can then be issued or denied accordingly. Infrastructure engineering and construction bids should also include a life cycle GHG emissions line item. Entrepreneurs should be encouraged to take heed and bring to market more green building solutions as well as tools to quickly and efficiently perform GHG emissions life cycle analysis (LCA). Financial incentives can be awarded for developments that lower GHG emissions beyond a set point, and regulators could even consider a tiered reward or penalty program that is linked to property tax.
Europe has been regulating embodied impacts and the Netherlands provides a best practice case study. Since 2013, the Dutch Building Act has required all buildings exceeding 100 m2 (1076 ft2 ) to account for their cradle-to-grave embodied impacts using a standardized assessment method (Bouwkwaliteit, 2014) and an associated database. The assessment assigns a shadow price to 11 LCA categories; these shadow prices combine to form one assessment metric. There is a mandatory cap of 1 EUR per square meter per year. Table 8 lists other leading examples of embodied carbon reduction strategies for consideration.
Table 8. Examples of embodied carbon reduction strategies Source: Toronto Atmospheric Fund; (Architect Magazine, 2021).
Regulating infrastructure life cycle carbon emissions
will have an indirect but desirable impact on industrial emissions
control, especially when the carbon price is sufficiently high.
Otherwise society will bear the real cost of climate change damages.
Manufacturers of building materials and fixtures will try to reduce
their own carbon footprint and choose greener transportation modes to
make their products more competitive. Construction companies will clean
up their practices to win more contracts. Given the linkages among these
sectors and their suppliers, the impact on emissions control will
spread beyond building related manufacturing. We recommend publicizing
the policy and its impact and letting consumers guide the rest of the
economy towards lower life cycle carbon intensity (Frank, 2020).
A Complex Dilemma. Land management and agricultural practices present a complex dilemma in relation to climate change, especially in the developing world, where the conflicting needs to preserve the ecosystem and to provide economic opportunities for the population are difficult to balance. The global food security issue alone puts expansion of agricultural lands in conflict with forest preservation. To balance the conflicting needs will require a coordinated set of measures (Bahar et al. 2020) including carbon price, reforestation programs, no-deforestation policies, as well as improved practices to enhance crop yields, reduce waste, and transition to less energy-intensive diets.
Protect Primary Forests. Today, we have only 4 billion hectares of forests of which only 1 billion hectares remain untouched by humans. These remaining billion hectares are the world’s remaining primary forests and they include the Amazon Rainforest in South America, Tongass National Forest in Alaska, and Great Bear Rainforest in British Columbia. There is an urgent need for forest protection (Project Drawdown, 2020). Forest trees absorb carbon dioxide and sequester it in their trunks, branches, leaves, and soil. Forests also house complex ecosystems (Lladó et al. 2017) that influence a forest’s ability to hold carbon, which potentially impact the feedback between the climate and the global carbon cycle. Primary forests hold approximately 141 GT of carbon.
Preserve Old Growth. Research (Köhl et al. 2017) has shown that 70% of all the carbon stored in trees is accumulated in the last half of their lives. The older the tree, the more stable its carbon sequestration. Furthermore, cutting down old growth and introducing young and short trees in its place changes the forest canopy, reducing its ability to maintain local humidity and to shield the forest floor from the scorching sun and higher temperatures. Rising temperatures beget hotter summers with prolonged droughts. Thus the microclimate becomes hotter and drier, which can cause the trees to shed leaves, close off their stomata, and curtail carbon dioxide uptake. Hence, there is a rising incidence of tree death (Welch, 2020) through increasingly intense forest fires and devastation from insects. While reforestation is better than leaving the land bare, it does not adequately compensate for the loss of old growth trees (Saxifrage, 2020).
Protect Coastal Wetlands. Like our primary forests, coastal wetlands – salt marshes, fresh- water marshes, mangrove swamps, forested swamps, and seagrass beds – are important carbon sinks. They can hold five times as much carbon as tropical forests over the long term. As well, they are complex and important ecosystems. Today, less than a quarter of the 53 million hectares of global coastal wetlands is protected. Threats to coastal wetlands (Borchert et al. 2018; Schoell, 2019) include residential and infrastructure development, erosion, subsidence, and rising sea levels.
Reduce Agricultural Emissions. Agriculture has the potential to act as a carbon sink (Levin et al. 2019; Levin & Davis, 2019) and help to achieve net-zero by 2050. However, an increase in world population coupled with pervasive meat diets will make the achievement challenging. In 2020, global food production was responsible for 13.7 GTCO2e (Ritchie & Roser, 2020c) emissions. By 2050, with the world population expected to rise to 9.77 billion (Ritchie & Roser, 2021), and with continued food waste, global emissions from food production could rise to over 30 GTCO2e per year (FAO, 2021a; Shrinkthatfootprint, 2015). Continued increases in carbon emissions from agriculture would make the achievement of any climate goal impossible.
Maintain Soil Health. The amount of carbon stored in soils (Ontl & Schulte, 2012) exceeds the amount in the atmosphere and the earth’s vegetation. Traditional soil management depletes the soil of its organic C (SOC), which is released into the atmosphere. Sustainable soil management, on the other hand, has the potential to accumulate SOC, which is good for both the climate and the soil itself. Even though studies (Lal, 2004) suggest that there is a large potential for SOC sequestration through restorative land use and recommended management practices, further research is needed.
Adopt Regenerative Agricultural Practices. There are a variety of methods being explored for improving soil health and sustainability (Project Drawdown, 2020). In regenerative agriculture, a set of practices are put in place to promote sustainable soil health including, refraining from tillage and the use of pesticides, using cover crops, multiple crop rotations, and no use of external fertilizers. In agroforestry (FAO, 2021 ), woody perennials (trees, shrubs, palms, etc.) are deliberately used on the same land-management units as agricultural crops and/or animals. Project Drawdown sees this approach as having significant potential for promoting better soil health, sustainability, and carbon storage capacity.
Silvopasture, and managed grazing are methods to address the harms of large-scale livestock grazing activities in pastures. In the former case, trees and ruminates are co-located. In the latter case, grazing lands are given sufficient time to be restored before being used for grazing again. Managed grazing is typically included in a set of silvopasture agronomic principles. These practices have some possible benefits to soil health and have potential to provide improved carbon sequestration relative to traditional grazing practices.
Reduce Industrial Fertilizer Use. Nitrogen is a critical limiting element for plant growth in the soil. Biological nitrogen fixation (Wagner, 2011) is a natural process through which certain plants can gain nitrogen directly from the atmosphere (where it is abundant). There are techniques, either through addition of certain microorganisms or through intercropping with Leguminosae species, that can accelerate this natural process significantly. Efficient biological nitrogen fixation practices might help reduce use of synthetic N fertilizer (Mendonça et al. 2017), thereby reducing CO2e emissions.
Beware of Bioenergy. The use of agricultural lands for bioenergy is controversial. Proper choice of crop, as well as avoidance of using arable land are critical to making bioenergy practices sustainable. Further studies are needed in order to develop policies consistent with net carbon emissions from manufacture and consumption of biomass fuels.
Active Removal. Active removal of CO2 through carbon capture, utilization, and sequestration technology (CCUST) is necessary concurrently with aggressive reduction of GHG emissions to achieve net-zero carbon emissions. One without the other will leave us short of our ability to achieve net zero by 2050. Industrialized countries like the US and EU should be responsible for removing more CO2 from the atmosphere than is in their carbon budgets because they have been responsible for almost 50% of historical emissions. In the case of the US, it also has one of the highest per capita carbon footprints in the world, even compared to EU nations, and has yet to commit to the ambitious targets embraced by the EU. Moreover, given its significant financial resources, the US should commit to removing 15-20% of the total needed and reduce its emissions to the per capita levels in other wealthy countries. These commitments should be initiated as soon as possible.
Our Choice of Emissions Pathway Dictates our Future Challenges. The emissions pathways in Table 2 illustrated how the removal requirements and the ability to limit temperature rise are impacted by delay in action. If US emission reductions start in 2021 (on a linear path to an 80% reduction of 2021 emissions in 2050, followed by linear reduction to zero in 2080), the cumulative emissions would be 1092 GTCO2 (see Table 2, pathway 2). For a temperature change target of 1.5oC, the removal requirement is 922 GTCO2. If the US accepts responsibility for 20% of the global removal requirement, then the US must remove 184 GTCO2. Assuming the removal starts in 2035 and ends in 2100, the annual negative emissions requirement for the US will be 2.8 GTCO2, or 50% of the current annual US GHG emissions. Waiting until 2031 to start on a path of 80% reduction by 2060 (pathway 6 in Table 2), the global removal requirement to limit temperature change to 1.5oC increases to 1442 GTCO2. The US responsibility would be 288 GTCO2, or an annual removal requirement of 7.2 GTCO2, or 130% of the current annual US GHG emissions, for 40 years. Thus, delaying any further will compound the problem and increase the cost of achieving net zero by 2050.
Large-Scale Removal. In order to implement large-scale active removal of CO2, carbon capture, utilization, and sequestration technology (CCUST) is likely to be necessary. The cost of CO2 removal is believed to be as high as $200/ton, and could drop to around $50/ton with technology advancement and large-scale implementation. Assuming an initial cost of $100/ton for removing CO2 from the atmosphere, the annual cost for carbon removal between 2 GTCO2 and 5 GTCO2 would be between $200 billion/year and $500 billion/year. On a per-capita basis, the removal cost would be between $530 and $1,300 per person per year, (assuming a population of 380 million in 2050). Every year of delay adds about 0.1 GTCO2 to the needed annual carbon capture and storage at an incremental cost of about $10 billion/year ($25/per person/year).
Costs of Removal vs. Inaction. The relevant basis of cost comparison for CCUST should not be the cost of fossil fuel usage. Rather, it should be weighed against the opportunity cost of not practicing CCUST, which would be the price of climate change. Given the recent trends (i.e., average annual costs of weather-related large disasters exceeding $100 billion), the costs eclipse the costs of large-scale carbon capture and sequestration in the near future.
Methods of Removal. A combination of technological methods and natural processes can potentially accomplish carbon removal (Tamme, 2021), including direct air capture with carbon storage (DACS), carbon capture and storage (CCS), carbon capture utilization and storage (CCUS), bioenergy with carbon capture and storage (BECCS), afforestation, reforestation, biochar soil carbon, enhanced weathering, and ocean fertilization. Afforestation and reforestation rely on growing trees, bamboo, and hemp, to capture carbon from the atmosphere. Biochar involves pyrolyzing biomass in a low-oxygen environment to produce a stable carbon-rich material that, when added to the soil, has soil health benefits and sequesters carbon. Enhanced weathering (Washington Post, 2020), a form of mineralization (Romanov et al. 2015), uses naturally or artificially produced minerals that absorb CO2 and incorporate carbon into other substances by reaction with water from rain, ground water, or sea water.
Ocean fertilization involves adding nutrients to the upper regions of the ocean to stimulate phytoplankton activity. The phytoplankton remove CO2 through photosynthesis. In short, carbon capture processes vary as to how CO2 is captured, what the source of CO2 is, and whether to utilize the captured CO2 (i.e. circular economy) or sequester it - for example in geologic formations (Global CSS Institute, 2018). The capture and storage characteristics of various types of CCUST are summarized in Table 9 and shown in Figure 18.
In direct air capture with carbon storage, CO2 is captured from the atmosphere, whereas in carbon capture and storage and carbon capture utilization and storage, it is captured during manufacturing processes or energy production. In bioenergy with carbon capture and storage, CO2 is captured from biofuel manufacture (e.g, from fermentation in production of methanol), or from production of energy from waste with significant biogenic content (e.g., waste-to-energy plants). The technology to capture CO2 from the atmosphere must be effective at low concentrations (<400 ppm). By contrast, the technology to capture CO2 from industrial processes operates at the significantly higher CO2 concentrations found in flue gas, and other forms of industrial waste gas. The technology to extract directly from air can be modularized and implemented close to the storage site, whereas the technology to extract CO2 from industrial processes must be located at the point of emission.
Reducing the green premium via a carbon tax and other measures (CPLC 2017, Stiglitz 2019) is critical to the advancement and adoption of carbon capture and conversion technologies. Allowing companies that adopt carbon capture or utilize products made from carbon dioxide to enjoy some incentives, such as tax breaks, carbon credits, and lower carbon intensity scores, will also help this up-and-coming sector to survive. At the same time, these taxes and incentives will also encourage more research on cleaner, better, and cheaper technologies that will pivot the economy onto a more robust growth path.
Table 9. Characteristics of Carbon Capture and Storage Modalities.

Figure 18. Capture and storage characteristics of various CCUST modalities.
True Net-Negative Emissions are Required. Carbon capture and storage do not necessarily enable a negative emission process. The details of how the CO2 is produced must be considered. For example, direct air capture with carbon storage can be used to reduce CO2 in the atmosphere, but is yet to be practiced on such a large scale as to completely offset emissions from a high-emission industrial process or high-emission power generation process. Removing CO2 from flue gas at the site of an industrial process will capture a higher fraction of the CO2 emissions, but will not completely eliminate them. In the case of bioenergy with carbon capture and storage, however, if it is coupled with a truly net-zero-emission biogenic CO2 process, significant removal and storage of CO2 emissions from that process will result in a negative emission technology.
Whether directly from air or from industrial exhaust gas, carbon capture methods need to be evaluated and measured by a certification entity adhering to internationally accepted standards, such as ISO 14064-1 and ISO 14064-2. Such certified measurements would highlight the net number tons of carbon dioxide removed. As technologies evolve, these standards might need enhancements to accommodate new pathways. Capturing the carbon dioxide is only half the equation. What to do with the carbon dioxide is the other piece. It can also be a resource to reduce our dependence on fossil-fuel-based chemistry. There are already some efforts to utilize this captured gas but most research has not progressed beyond the laboratory.
The above mentioned capture and storage technologies are in varying stages of readiness for implementation (IEA, 2020). Additional effort is required to bring the most promising approaches to the required scale. Therefore, dramatic emissions reductions must be achieved while developing the capture and storage technologies, with the hope of implementing them with sufficient capacity to address the remaining emissions reductions required to get to net-zero and possibly net-negative emissions.
For removal of CO2
on a global scale, the costs will pose a varying degree of difficulty
for each country. An equitable way must be found to pay for the removal.
Considerations in allocating quotas (Pozo et al. 2020)
to specific countries include: population, the ability to pay (GDP),
current emissions, historical emissions, and current standard of living.
Climate change is an existential problem confronting human society, unlike any other we have faced in history. Science has shown us that the fossil fuel energy systems and technologies which are responsible for advancing the developed world into this century cannot solve the resulting climate change that the planet is confronting. With the confluence of the COVID-19 pandemic taking millions of lives and climate change disasters costing hundreds of billions of dollars over the past year, the need to change course could not be more immediate or urgent. The risks associated with staying on the current course are too great to ignore.
The world has already experienced unprecedented damages from climate change in the twenty-first century and there is no doubt about the ongoing historic changes on Earth. The United Nations, along with many government agencies and non-governmental organizations, have provided detailed scientific analyses which are summarized in this Roadmap. The problems and challenges are global and require coordinated actions on the part of the world’s governments and citizens. Even with coordinated and immediate action, change will require decades. Without a global commitment and corresponding action for responding to climate change, there is little doubt that, not only will many of Earth’s natural cycles and ecosystems be adversely impacted, but also human habitability may be threatened on large swaths of our planet.
Leadership and investment in climate solutions is imperative starting with the world’s developed countries and extending to all others, including the large developing ones. In order to mitigate the most serious impacts of climate change, our recommendation herein is to take actions that will yield a world that is carbon-neutral within a generation, but no later than 2050. We believe that it is critical for the US NDC to be greatly increased at the upcoming UNFCCC COP-26 meeting and should target 36% reduction by 2025 and 55% by 2030 compared to the 2005 emission level. These commitment targets should keep the US on pace to meet the IPCC target for limiting global warming to less than 2°C by the end of the century and provide the moral and technological leadership necessary globally, together with the EU and UK.
Coordinated leadership of Europe and the US is critical to engaging other countries in making similarly aggressive commitments and providing resources to countries which currently bear the largest impacts of climate change and the largest socioeconomic pressures against taking immediate action. For the largest historic emitters with the greatest technical and economic resources - the US, for example - such leadership is a moral responsibility. A greater sense of urgency is needed to prevent the worst damages which will otherwise result and indeed are resulting from climate change. These effects include global temperature rise, warming oceans, melting polar ice, glacial retreat, sea level rise, extreme weather events, and ocean acidification.
The recent joint announcement from the UK and US (US State Department, 2021) is encouraging but concrete steps are necessary. The immediate actions needed to mitigate climate change include use of existing proven and economical carbon-neutral technologies to reduce emissions as rapidly as possible. Most notably, reduce and/or eliminate fossil fuel power generation in favor of non-carbon emitting power generation, especially renewable solar and wind power which are now clearly the least expensive options; electrify transportation; eliminate most industrial and residential use of fossil fuels through improved efficiencies and cost-effective electrification; and improve land management, including reduction of agricultural emissions.
Research and climate models indicate that one of the most efficient and effective measures that can be taken to reduce GHG emissions is a carbon price. Damages from climate change disasters cost $100 billion in the US alone in 2020 and this number has been rising rapidly. Effective and immediate incorporation of these costs into a carbon market will leverage market forces to drive change. In addition to ignoring the social costs of fossil fuel consumption, subsidies that support current fossil fuel markets wrongly reward the fossil fuel industry for causing further harm. Such subsidies also impede the essential transformation away from coal, natural gas, and gasoline. A carbon price in isolation must be avoided as it has a regressive impact that raises a social justice challenge. A price with an appropriate dividend mechanism is required to compensate for the regressive nature of the carbon price.
As suggested in “Accelerating Decarbonization of the US Energy System” (NASEM, 2021), complementary interventions, such as federal emissions standards, state standards and policies, local standards and corporate initiatives, are needed to drive a rapid transition to carbon-neutral energy. Longer term, research and development of technologies that hold the most promise for sustainability, resiliency, and negative emissions are essential, but due to the long time horizon for their likely implementation, investments are needed immediately. Reducing certain industrial and heavy industry use of fossil fuels will require developing new solutions. Although economical negative emission technologies will likely take longer to deliver, reversing the accumulation of greenhouse gases may allow us to reverse negative economic and health impacts to the world’s population, especially those most vulnerable to climate change.
The rate at which changes occur will determine the magnitude of damages which will result long-term. Beyond the changes in policy and regulations, speed of translation of ideas to incubation and commercialization of green products, as well as consumer awareness, are necessary to drive the climate transformation agenda forward faster. Communication campaigns need to be reinforced and expanded to make climate a mainstream topic today and to avoid further delay.
Acknowledgments
We thank the following for providing permission to reproduce data and figures:
NOAA NCEI, Luthi et al., GISTEMP, UNFCCC, IPCC data, van Vuuren et al., PNAS, Our World in Data, Carbon Dioxide Analysis Center, Global Carbon Project, International Energy Agency, Union of Concerned Scientists, Carbon Delta, US Energy Information Administration, Environmental Protection Agency, LLNL, IRENA, Alternative Fuels Data Center, Lu et al., C40 Knowledge Hub, Moss et al., Climate Change data Center, Climate Action Tracker, Architect Magazine
Bibliography
Agrawal, A. (2008). The Role of Local Institutions in Adaptation to Climate Change, World Bank. Retrieved on February 3, 2021 from https://openknowledge.worldbank.org/bitstream/handle/10986/28274/691280WP0P11290utions0in0adaptation.pdf?sequence=isAllowed=
Alonso, L., Zhang, Y. R., Grignard, A., Noyman, A., Sakai, Y., ElKatsha, M., Doorley, R., Larson, K. (2018). CityScope: A Data-Driven Interactive Simulation Tool for Urban Design. Use Case Volpe,. In A. Morales C. Gershenson, D. Braha, A. Minai, and Y. Bar-Yam, eds., Unifying Themes in Complex Systems IX. ICCS 2018. Springer Proceedings in Complexity. Springer, Cham., pp. 253–261. https://doi.org/10.1007/978-3-319-96661-8_27
Alternative Fuels Data Center (2020). Retrieved April 10, 2021, from https://afdc.energy.gov/data/widgets/10309
American Public Transportation Association (2021). Zero Emission Bus. Retrieved April 10, 2021, from https://www.apta.com/research-technical-resources/zero-emission-bus/
ARB (2015). ARB Emissions Trading Program, Air Resources Board of the California Environmental Protection Agency. Retrieved on April 15, 2021 from www.arb.ca.gov
Architect Magazine (2021). Policies for Embodied Carbon: An International Snapshot. Retrieved April 11, 2021, from https://www.architectmagazine.com/practice/policies-for-embodied-carbon-an-international-snapshot_o
Augustin, Laurent, Barbante, C., Barnes, P.R., Marc B., Bigler, M., Castellano, E., Cattani, O., Chappellaz, J. , Dahl-Jensen, D. m Delmonte, B., Dreyfus, G., Durand, G., Falourd, S, Fischer, H, Flückiger, J., Hansson, M.E., Huybrechts, P, Jugie, G., Johnsen, S.J., Jouzel, J., Kaufmann, P., Kipfstuhl, J., Lambert, F, Lipenkov, V.Y., Littot, G.C., Longinelli, A., Lorrain, R., Maggi, V., Masson-Delmotte, V., Miller, H., Mulvaney, R., Oerlemans, J., Oerter, H., Orombelli, G., Parrenin, F., Peel, D., Petit, J.-R., Raynaud, D., Ritz, C., Ruth, U., Schwander, J., Siegenthaler, U., Souchez, R., Stauffer, B., Peder Steffensen, J., Stenni, B., Stocker, T.F., Tabacco, I.E., Udisti, R., van de Wal, R.S.W., van den Broeke, M., Weiss, J., Wilhelms, F., Winther, J.-G., Wolff, E.W., Zucchelli, M., EPICA (2004). Eight glacial cycles from an Antarctic ice core EPICA community members. Nature, 429, 623–628. https://doi.org/10.1038/nature02599
Bahar, N. H. A., Lo, M., Sanjaya, M., Van Vienan, J., Alexander, P., Ickowitz, A.,Sunderland, T. (2020). Meeting the food security challenge for nine billion people in 2050: What impact on forests? In Global Environmental Change, Vol. 62, Elsevier Ltd, p. 102056. https://doi.org/10.1016/j.gloenvcha.2020.102056.
Baker, S. E., Stolaroff, J. K., Peridas, G., Pang, S., Goldstein, H., Lucci, F., Li, W., Slessarev, E.W., Pett-Ridge, J., Ryerson, F.J., Wagoner, J. L., Kirkendall, W., Aines, R.D., Sanchez, D.L., Cabiyo, B., Baker, J., McCoy, S., Uden, S., Runnebaum, R., Wilcox, J., Psarras, P.C., Pilorge, H., McQueen, N., Maynard, D., McCormick, C. (2019). Getting to Neutral: Options for Negative Carbon Emissions in California. https://doi.org/10.2172/1597217. Retrieved from https://www-gs.llnl.gov/content/assets/docs/energy/Getting_to_Neutral.pdf
Barandiarán, J. (2019). Lithium and development imaginaries in Chile, Argentina and Bolivia. World Development, 113, 381–391. https://doi.org/10.1016/j.worlddev.2018.09.019
Bartlett, J., & Krupnick, A. (2020). Decarbonized Hydrogen in the US Power and Industrial Sectors: Identifying and Incentivizing Opportunities to Lower Emissions. Resources for the Future. Downloaded from https://media.rff.org/documents/RFF_Report_20-25_Decarbonized_Hydrogen.pdf
BC Climate Action Toolkit (2021). Southeast False Creek Neighbourhood Energy Utility (NEU). Retrieved April 11, 2021, from https://www.toolkit.bc.ca/success-story/southeast-false-creek-neighbourhood-energy-utility-neu
Bureau of Transportation Statistics (2021). Average Age of Automobiles and Trucks in Operation in the United States. Retrieved April 10, 2021, from https://www.bts.gov/content/average-age-automobiles-and-trucks-operation-united-states
Borchert, S. M., Osland, M. J., Enwright, N. M., & Griffith, K. T. (2018). Coastal wetland adaptation to sea level rise: Quantifying potential for landward migration and coastal squeeze. Journal of Applied Ecology, 55(6), 2876–2887.
Bossio, D. (2020). Solid Ground: Earth’s Soils Reveal Climate, Biodiversity & Food Security Solutions. Retrieved from https://www.nature.org/en-us/what-we-do/our-insights/perspectives/soils-revealed-climate-biodiversity-food-solutions/?src=s_two.gc.x.x.&sf133762363=1
Bouwkwaliteit, S. (2014). Assessment Method: Environmental Performance Construction and Civil Engineering Works . Retrieved from https://milieudatabase.nl/wp-content/uploads/2019/05/SBK_Assessment_method_version_2_0_TIC_versie.pdf
Bowler, J. (2020). Scientists Grab First Glimpse Deep Underneath Antarctica’s Unstable Thwaites Glacier. Retrieved from https://www.sciencealert.com/scientists-discover-what-s-underneath-the-unstable-thwaites-glacier
BP (2021). Introducing 10 new aims for tracking bp’s sustainability performance. Retrieved April 10, 2021, from https://www.bp.com/en/global/corporate/news-and-insights/reimagining-energy/introducing-our-next-10-aims.html
Bureau of Transportation Statistics (2021). Average Age of Aircraft 2019. Retrieved April 10, 2021, from https://www.bts.gov/average-age-aircraft-2019
Burke, K. D., Williams, J. W., Chandler, M. A., Haywood, A. M., Lunt, D. J., & Otto-Bliesner, B. L. (2018). Pliocene and Eocene provide best analogs for near-future climates. Proceedings of the National Academy of Sciences of the United States of America, 115(52), 13288–13293. https://doi.org/10.1073
C40 knowledge Hub (2021). Embodied Carbon of Buildings and Infrastructure: International Policy Review, Retrieved April 11, 2021, from https://www.c40knowledgehub.org/s/article/Embodied-Carbon-of-Buildings-and-Infrastructure-International-Policy-Review?language=en_US
CALSTART (2020). Drive to Zero’s Zero-emission Technology Inventory (ZETI) Tool Version 5.9. Retrieved from https://globaldrivetozero.org/tools/zero-emission-technology-inventory/
Carbicrete (2018). Game-Changing Concrete Technology. Retrieved April 11, 2021, from https://carbicrete.com/technology/
CarbonCure (2021). Innovative CO2 Technology. Retrieved April 11, 2021, from https://www.carboncure.com/technology/
CAT (2020). Climate Action Tracker. Countries. Retrieved April 10, 2021, from https://climateactiontracker.org/countries/
CAT (2021). Climate Action Tracker. Climate Target Update Tracker. Retrieved April 10, 2021, from https://climateactiontracker.org/climate-target-update-tracker/
CC Data Center (2021a). Retrieved April 10, 2021, https://myccnews.org/(S(5fk2r0vs4cfhhxedkftn5jbk))/image.aspx?ImageID=295
CC Data Center (2021b). Retrieved April 10, 2021, from https://ccdatacenter.org/images/Standard/2018USGreenhouseGasEmissions8211ADirectE7304.png
CC Data Center (2021c). Retrieved April 10, 2021, from https://ccdatacenter.org/FossilFuelQuads.aspx
CDC (2021). Number and rate of occupational mining fatalities by year, 1983 - 2019. Retrieved April 10, 2021, from https://wwwn.cdc.gov/NIOSH-Mining/MMWC/Fatality/NumberAndRate?StartYear=1983&EndYear=2019&SelectedOperatorType=&SelectedMineType=
Cheng, L., Abraham, J., Zhu, J., Trenberth, K., Fasullo, J. ,Boyer, T., Locarnini, R.,Zhang, B., Yu, F., Wan, L., Chen, X., Song, X., Liu, Y., Mann, M.E. (2020). Record-Setting Ocean Warmth Continued in 2019. Advances in Atmospheric Sciences, 37(2), 137–142. https://doi.org/10.1007/s00376-020-9283-7
Climate Xchange (2021). Regional Carbon Pricing Initiatives. Retrieved April 10, 2021 from https://climate-xchange.org/regional-cap-and-invest/#wci
Colorado Mesa University (2021). Geo-exchange Systems. Retrieved April 11, 2021, from https://www.coloradomesa.edu/facilities/sustainability/geo-systems.html
Core Writing Team, R. K. P. and L. A. M. (2014). Climate Change 2014: Synthesis Report, Geneva, Switzerland,: IPCC. Retrieved from https://ar5-syr.ipcc.ch/ipcc/ipcc/resources/pdf/IPCC_SynthesisReport.pdf
CPLC (2017). Carbon Pricing Leadership Coalition, Report of the High-Level Commission on Carbon Prices. Retrieved from https://static1.squarespace.com/static/54ff9c5ce4b0a53decccfb4c/t/59b7f2409f8dce5316811916/1505227332748/CarbonPricing_FullReport.pdf
CSS (2020). Center for Sustainable Systems, University of Michigan, Wind Energy Factsheet Pub. No. CSS07-09. Retrieved from http://css.umich.edu/sites/default/files/Wind Energy_CSS07-09_e2020.pdf
Data Center Frontier (2020). Waste Heat Utilization is the Data Center Industry’s Next Step Toward Net-Zero Energy. Retrieved April 11, 2021, from https://datacenterfrontier.com/waste-heat-utilization-data-center-industry/
Deng, Y. Y., Haigh, M., Pouwels, W., Ramaekers, L., Bransmaa, R., Schimschar, S., Grözinger, J., & de Jager, D. (2015) Quantifying a realistic, worldwide wind and solar electricity supply. Global Environmental Change, 31, 239–252. https://doi.org/10.1016/j.gloenvcha.2015.01.005
DOE Office of Energy Efficiency (2021). Batteries, Charging, and Electric Vehicles. Retrieved April 10, 2021, from https://www.energy.gov/eere/vehicles/batteries-charging-and-electric-vehicles
DOE website (2021). Zero Energy Buildings. Retrieved April 11, 2021, from https://www.energy.gov/eere/buildings/zero-energy-buildings
Duke Energy (2020). Achieving a net zero carbon future. Retrieved from https://www.duke-energy.com/_/media/pdfs/our-company/climate-report-2020.pdf?la=en
EIA (2018). U.S. District Energy Services Market Characterization, U.S. Energy Information Administration. Retrieved from https://docs.google.com/document/d/1ORtuBq-dhjP7ETzK--_icscTmj0KCfGeGX2tx13tXKo/edit?ts=60779050#
EIA (2020a). Where greenhouse gases come from, based on data from Monthly Energy Review, July 2020 (https://www.eia.gov/totalenergy/data/monthly/archive/00352007.pdf), U.S. Energy Information Administration. Retrieved April 10, 2021, from https://www.eia.gov/energyexplained/energy-and-the-environment/where-greenhouse-gases-come-from.php
EIA (2020b). U.S. Energy Information Administration Data. Retrieved April 10, 2021, from https://www.eia.gov/totalenergy/data/browser/?tbl=T11.01#/?f=A
Environmental Defense Fund (2021). The true cost of carbon pollution. Retrieved on April 15, 2021 from https://www.edf.org/true-cost-carbon-pollution
EPA (2017). Climate Impacts on Coastal Areas. U.S. Environmental Protection Agency. Retrieved from https://19january2017snapshot.epa.gov/climate-impacts/climate-impacts-coastal-areas_.html
EPA (2020a). Fast Facts from the Inventory of U.S. Greenhouse Gas Emissions and Sinks: 1990–2018, U.S. Environmental Protection Agency. Retrieved from https://www.epa.gov/sites/production/files/2020-04/documents/fastfacts-1990-2018.pdf
EPA (2020b). Inventory of U.S. Greenhouse Gas Emissions and Sinks: 1990–2018, U.S. Environmental Protection Agency. Retrieved from https://www.epa.gov/ghgemissions/inventory-us-greenhouse-gas-emissions-and-sinks-1990-2018
EPA (2020c). Green Vehicle Guide: Fast Facts on Transportation Greenhouse Gas Emissions, U.S. Environmental Protection Agency. Retrieved from https://www.epa.gov/greenvehicles/fast-facts-transportation-greenhouse-gas-emissions
European Commission (2020a). Recovery plan for Europe. Retrieved April 5, 2021, from https://ec.europa.eu/info/strategy/recovery-plan-europe_en
European Commission (2020b). Circular Economy Action Plan. Retrieved April 10, 2021, from https://ec.europa.eu/environment/circular-economy/
ExxonMobil (2021). ExxonMobil and Porsche test lower-carbon fuel in race conditions. Retrieved April 10, 2021, from https://corporate.exxonmobil.com/News/Newsroom/News-releases/2021/0330_ExxonMobil-and-Porsche-test-lower-carbon-fuel-in-race-conditions
Fares, R. (2015). Renewable Energy Intermittency Explained: Challenges, Solutions, and Opportunities, Scientific American Blog Network. Retrieved April 11, 2021, from https://blogs.scientificamerican.com/plugged-in/renewable-energy-intermittency-explained-challenges-solutions-and-opportunities/
Federation of Canadian Municipalities (2021). Case study: Energy-efficient community centre uses geothermal heat. Retrieved April 11, 2021, from https://fcm.ca/en/resources/gmf/case-study-energy-efficient-community-centre-uses-geothermal-heat
FAO (2017). The Impact of disasters and crises on agriculture and Food Security, Food and Agriculture Organization of the United Nations. Retrieved from www.fao.org/publications
FAO (2021a). Food waste footprint and climate change, Food and Agriculture Organization of the United Nations. Retrieved April 17, 2021 from http://www.fao.org/3/bb144e/bb144e.pdf
FAO. (2021b). Agroforestry, Food and Agriculture Organization of the United Nations. Retrieved April 11, 2021, from http://www.fao.org/forestry/agroforestry/80338/en/
Fox-Penner, P., Gorman, W., & Hatch, J. (2018). Long-term U.S transportation electricity use considering the effect of autonomous-vehicles: Estimates & policy observations. Energy Policy, 122, 203–213. https://doi.org/10.1016/j.enpol.2018.07.033
Frank, R. H. (2020). Behavioral Contagion Could Spread the Benefits of a Carbon Tax, -New York Times. Retrieved April 11, 2021, from https://www.nytimes.com/2020/08/19/business/behavioral-contagion-carbon-tax.html?auth=login-email&login=email
Fredriksson, H., Dahl, M., & Holmgren, J. (2019). Optimal placement of charging stations for electric vehicles in large-scale transportation networks. In Procedia Computer Science, Vol. 160, Elsevier B.V., pp. 77–84. https://doi.org/10.1016/j.procs.2019.09.446
Friedlingstein, P., O'Sullivan, M., Jones, M. W., Andrew, R. M., Hauck, J., Olsen, A., Peters, G. P., Peters, W., Pongratz, J., Sitch, S., Le Quéré, C., Canadell, J. G., Ciais, P., Jackson, R. B., Alin, S., Aragão, L. E.O.C., Arneth, A., Arora, V., Bates, N. R., Becker, M., Benoit-Cattin, A., Bittig, H. C., Bopp, L., Bultan, S., Chandra, N., Chevallier, F., Chini, L. P., Evans, W., Florentie, L., Forster, P. M., Gasser, T., Gehlen, M., Gilfillan, D., Gkritzalis, T., Gregor, L., Gruber, N., Harris, I., Hartung, K., Haverd, V., Houghton, R. A., Ilyina, T., Jain, A. K., Joetzjer, E., Kadono, K., Kato, E., Kitidis, V., Korsbakken, J. I., Landschützer, P., Lefèvre, N., Lenton, A., Lienert, S., Liu, Z., Lombardozzi, D., Marland, G., Metzl, N., Munro, D. R., Nabel, J. E.M.S., Nakaoka, S. I., Niwa, Y., O'Brien, K., Ono, T., Palmer, P. I., Pierrot, D., Poulter, B., Resplandy, L., Robertson, E., Rödenbeck, C., Schwinger, J., Séférian, R., Skjelvan, I., Smith, A. J.P., Sutton, A. J., Tanhua, T., Tans, P. P., Tian, H., Tilbrook, B., Van Der Werf, G., Vuichard, N., Walker, A. P., Wanninkhof, R., Watson, A. J., Willis, D., Wiltshire, A. J., Yuan, W., Yue, X., Zaehle, S. (2020) Global Carbon Budget 2020. In Earth System Science Data. 2020, Vol. 12, No. 4. pp. 3269-3340. https://doi.org/10.5194/essd-12-3269-2020
Gimon, E., O’Boyle, M., Clack, C. T. M., McKee, S. (2019). The Coal Cost Crossover: Economic Viability of Existing Coal Compared to New Local Wind and Solar resources. Retrieved on April 17, 2021 from https://energyinnovation.org/wp-content/uploads/2019/04/Coal-Cost-Crossover_Energy-Innovation_VCE_FINAL2.pdf
GISTEMP Team (2021). GISS Surface Temperature Analysis (GISTEMP), version 4,National Aeronautics and Space Administration Goddard Institute for Space Studies. Retrieved March 29, 2021, from https://data.giss.nasa.gov/gistemp/
Global CSS Institute (2018). Fact sheet Geological Storage of CO2 2018. Retrieved from https://www.globalccsinstitute.com/wp-content/uploads/2018/12/Global-CCS-Institute-Fact-Sheet_Geological-Storage-of-CO2.pdf
Guardian (2019). Concrete: the most destructive material on Earth. Retrieved April 11, 2021, from https://www.theguardian.com/cities/2019/feb/25/concrete-the-most-destructive-material-on-earth
H.R.1960 - 116th Congress (2019-2020): Healthy Climate and Family Security Act of 2019. Congress.gov. Library of Congress. Retrieved April 10, 2021, from https://www.congress.gov/bill/116th-congress/house-bill/1960
H.R.3966 - 116th Congress (2019-2020): Raise Wages, Cut Carbon Act of 2019. Congress.gov. Library of Congress. Retrieved April 10, 2021, from https://www.congress.gov/bill/116th-congress/house-bill/3966
H.R.4051 - 116th Congress (2019-2020): Climate Action Rebate Act of 2019. Congress.gov. Library of Congress. Retrieved April 10, 2021, from https://www.congress.gov/bill/116th-congress/house-bill/4051
H.R.4058 - 116th Congress (2019-2020): SWAP Act. Congress.gov. Library of Congress. Retrieved April 10, 2021, from https://www.congress.gov/bill/116th-congress/house-bill/4058
H.R.4447 - 116th Congress (2019-2020): Clean Economy Jobs and Innovation Act. Congress.gov. Library of Congress. Retrieved April 10, 2021, from https://www.congress.gov/bill/116th-congress/house-bill/4447?q=%7B%22search%22%3A%5B%22h.R.4447%22%5D%7D&r=2&s=2
H.R.5221 - 116th Congress (2019-2020): 100% Clean Economy Act of 2019. Congress.gov. Library of Congress. Retrieved April 9, 2021, from https://www.congress.gov/bill/116th-congress/house-bill/5221?q=%7B%22search%22%3A%5B%22hr5221%22%5D%7D&s=2&r=1
H.R.5457 - 116th Congress (2019-2020): Carbon Reduction and Tax Credit Act. Congress.gov. Library of Congress. Retrieved April 10, 2021, from https://www.congress.gov/bill/116th-congress/house-bill/5457
H.R.5742 - 116th Congress (2019-2020): Energy PRICE Act. Congress.gov. Library of Congress. Retrieved April 10, 2021, from https://www.congress.gov/bill/116th-congress/house-bill/5742?r=9&s=1
H.R.6171 - 116th Congress (2019-2020): Moving Towards A Safe Climate Act. Congress.gov. Library of Congress. Retrieved April 9, 2021, from https://www.congress.gov/bill/116th-congress/house-bill/6171?q=%7B%22search%22%3A%5B%22HR6171%22%5D%7D&r=1&s=1
H.R.7393 - 116th Congress (2019-2020): Growing Climate Solutions Act of 2020. Congress.gov. Library of Congress. Retrieved April 9, 2021, from https://www.congress.gov/bill/116th-congress/house-bill/7393/text
H.R.763 - 116th Congress (2019-2020): Energy Innovation and Carbon Dividend Act of 2019. Congress.gov. Library of Congress. Retrieved April 10, 2021, from https://www.congress.gov/bill/116th-congress/house-bill/763
Hausfather, Z. (2021). State of the climate: 2020 ties as warmest year on record. Retrieved from https://www.carbonbrief.org/state-of-the-climate-2020-ties-as-warmest-year-on-record
Hu, S., Sprintall, J., Guan, C., et al. (2020). Deep-reaching acceleration of global mean ocean circulation over the past two decades. Science Advances, 6(6), 1–9. DOI: 10.1126/sciadv.aax7727
IEA (2020). Energy Technology Perspectives 2020 - Special Report on Carbon Capture Utilisation and Storage: CCUS in clean energy transitions, International Energy Agency, OECD Publishing, Paris, https://doi.org/10.1787/208b66f4-en.
IEA (2019). Emissions – Global Energy & CO2 Status Report 2019 – Analysis, International Energy Agency. Retrieved April 10, 2021, from https://www.iea.org/reports/global-energy-co2-status-report-2019/emissions
IEA (2021). IEA Atlas of Energy, International Energy Agency. Retrieved on April 15, 2021 from http://energyatlas.iea.org/#!/tellmap/1378539487
IPCC (2018). In V. Masson-Delmotte, P. Zhai, H.-O. Pörtner, D. Roberts, J. Skea, P.R. Shukla, A. Pirani, W. Moufouma-Okia, C. Péan, R. Pidcock, S. Connors, J.B.R. Matthews, Y. Chen, X. Zhou, M.I. Gomis, E. Lonnoy, T. Maycock, M. Tignor, and T. Waterfield, eds., IPCC, 2018: Summary for Policymakers. In: Global Warming of 1.5°C. An IPCC Special Report on the impacts of global warming of 1.5°C above pre-industrial levels and related global greenhouse gas emission pathways, in the context of strengthening the global response to the threat of climate change, sustainable development, and efforts to eradicate poverty.
IRENA (2019). Global energy transformation: A roadmap to 2050 (2019 edition), International Renewable Energy Agency, Abu Dhabi. Retrieved April 17, 2021 from https://irena.org/publications/2019/Apr/Global-energy-transformation-A-roadmap-to-2050-2019Edition
IRENA (2020). Renewable Power Generation Costs in 2019, International Renewable Energy Agency, Abu Dhabi. Retrieved from https://www.irena.org/-/media/Files/IRENA/Agency/Publication/2020/Jun/IRENA_Power_Generation_Costs_2019.pdf
Jacobson, M. Z. (2020). 100% Clean, Renewable Energy and Storage for Everything, Cambridge University Press. doi:10.1017/9781108786713
Jones, M. W., Smith, A., Betts, R., Canadell, J. G., Prentice, I. C., & Le Quéré, C. (2020). Climate change increases the risk of wildfires. Rapid Response Review, (March 2013), 2013–2015. Retrieved April 17 from https://tyndall.ac.uk/sites/default/files/wildfires_briefing_note.pdf
Köhl, M., Neupane, P. R., & Lotfiomran, N. (2017). The impact of tree age on biomass growth and carbon accumulation capacity: A retrospective analysis using tree ring data of three tropical tree species grown in natural forests of Suriname. PLOS ONE, 12(8), e0181187. https://doi.org/10.1371/journal.pone.0181187
Krugman, P. (2020). Apocalypse Becomes the New Normal We’re already in the early stages of climate crisis. The New York Times . Retrieved from https://www.nytimes.com/2020/01/02/opinion/climate-change-australia.html
Lal, R. (2004). Soil carbon sequestration to mitigate climate change. Geoderma, 123(1–2), 1–22. https://doi.org/10.1016/j.geoderma.2004.01.032
Lan, R., Moreau, S., & Faber, O. (2020). Low-Carbon Climate Adaptation Strategies for Paris Center 4.433. Urban Energy Modeling-Final Presentation. Retrieved from http://web.mit.edu/sustainabledesignlab/projects/UMIverse/2020_Paris/2020_Paris.pdf
Larsen, K., Pitt, H., & Rivera, A. (2021). Preliminary US Greenhouse Gas Emissions Estimates for 2020. Retrieved from https://rhg.com/research/preliminary-us-emissions-2020/
Lazard. (2020). Levelized Cost of Energy and of Storage. Retrieved April 10, 2021, from https://www.lazard.com/perspective/lcoe2020
Lenton, T. M., Rockström, J., Gaffney, O., Rahmstorf, S., Richardson, K., Steffen, W., Schellnhuber, H. J. (2019). Climate tipping points - too risky to bet against. Nature, 575(7784), 592–595. https://doi.org/10.1038/d41586-019-03595-0
Levin, K., & Davis, C. (2019, September 17). What Does “Net-Zero Emissions” Mean? 6 Common Questions, Answered. World Resources Institute. Retrieved April 11, 2021, from https://www.wri.org/blog/2019/09/what-does-net-zero-emissions-mean-6-common-questions-answered
Levin, K., Rich, D., Ross, K., Fransen, T., & Elliott, C. (2019). Designing and communicating net-zero targets. Retrieved from www.wri.org/design-net-zero.
Li, C. (2008). China to shut factories ahead of Olympics. Reuters. Retrieved April 10, 2021, from https://www.reuters.com/article/us-olympics-closures/china-to-shut-factories-ahead-of-olympics-sources-idUSSP3834220080704
Lim, X. (2017). How heat from the Sun can keep us all cool. Nature, 542, 23-4. doi:10.1038/542023a
Lindsey, R. (2020). Climate Change: Atmospheric Carbon Dioxide. Retrieved from https://www.climate.gov/news-features/understanding-climate/climate-change-atmospheric-carbon-dioxide
Lladó, S., López-Mondéjar, R., & Baldrian, P. (2017). Forest Soil Bacteria: Diversity, Involvement in Ecosystem Processes, and Response to Global Change. Microbiology and Molecular Biology Reviews, 81(2). doi:10.1128/mmbr.00063-16
Los Angeles Times (2019). Los Angeles OKs a deal for record-cheap solar power and battery storage. Retrieved April 10, 2021, from https://www.latimes.com/environment/story/2019-09-10/ladwp-votes-on-eland-solar-contract
Lovejoy, T. E., & Nobre, C. (2019). Amazon tipping point: Last chance for action. Science Advances, 5(12), 4–6. DOI: 10.1126/sciadv.aba2949
Lowe, J. A., & Bernie, D. (2018). The impact of Earth system feedbacks on carbon budgets and climate response. Philosophical Transactions of the Royal Society A: Mathematical, Physical and Engineering Sciences, 376(2119), 20170263. https://doi.org/10.1098/rsta.2017.0263
Lu, Y., Rong, X., Hu, Y. S., Chen, L., & Li, H. (2019). Research and development of advanced battery materials in China. Energy Storage Materials, 23,144–153. https://doi.org/10.1016/j.ensm.2019.05.019
Lunsford, D. (2020). Personal Communication, MSCI Climate Risk Center..
Luthi, D. et. al. (2008a). EPICA Dome C Ice Core 800KYr Carbon Dioxide Data. IGBP PAGES/World Data Center for Paleoclimatology, NOAA/NCDC Paleoclimatology Program.
Lüthi, D., Le Floch, M., Bereiter, B., Blunier, T., Barnola, J.M., Siegenthaler, U., Raynaud, D., Jouzel, J., Fischer, H., Kawamura, K., Stocker, T. F. (2008b). High-resolution carbon dioxide concentration record 650,000-800,000 years before present. Nature, 453(7193), 379-82. https://doi.org/10.1038/nature06949
Madson, D. (2021). Arkansas school district goes solar, boosts teacher pay? Yale Climate Connections. Retrieved April 11, 2021, from https://yaleclimateconnections.org/2021/02/arkansas-school-district-goes-solar-boosts-teacher-pay/
Maher, K. (2014). Tipping points and climate change: Revisiting The Day After Tomorrow. Retrieved March 28, 2021, from https://www.c2es.org/2014/09/tipping-points-and-climate-change-revisiting-the-day-after-tomorrow/
Marcu, A., Mehling, M., Cosbey, A., Dybka, D., Agrotti, D., Caspani, M., Vangenechten, D. (2020). Border Carbon Adjustments in the EU Issues and Options ERCST. Retrieved on April 15, 2021 from https://secureservercdn.net/160.153.137.163/z7r.689.myftpupload.com/wp-content/uploads/2020/09/20200929-CBAM-Issues-and-Options-Paper-F-2.pdf
Mass.gov. (2021). How Massachusetts Households Heat Their Homes. Retrieved April 11, 2021, from https://www.mass.gov/service-details/how-massachusetts-households-heat-their-homes
McKinsey (2020). Europe’s path to decarbonization. Retrieved April 10, 2021, from https://www.mckinsey.com/business-functions/sustainability/our-insights/how-the-european-union-could-achieve-net-zero-emissions-at-net-zero-cost#
Mendonça, E. de S., Lima, P. C. de, Guimarães, G. P., Moura, W. de M., & Andrade, F. V. (2017). Biological Nitrogen Fixation by Legumes and N Uptake by Coffee Plants. Revista Brasileira de Ciência Do Solo, 41. doi:10.1590/18069657rbcs20160178
MIT Media Lab. (2021). Introduction: What is CityScope? MIT Media Lab City Science Group. Retrieved April 11, 2021, from https://cityscope.media.mit.edu/
Mora, C., Spirandelli, D., Franklin, E. C., Lynham, J., Kantar, M. B., Miles, W., Smith, C.Z., Freel, K., Moy, J., Louis, L. V., Barba, E.W., Bettinger, K., Frazier, A.G., Colburn IX, J. F., Hanasaki, N., Hawkins, E., Hirabayashi, Y., Knorr, W., Little, C. M., Emanuel, K., Sheffield, J., Patz, J. A., Hunter, C. L. (2018). Broad threat to humanity from cumulative climate hazards intensified by greenhouse gas emissions. Nature Climate Change, 8(12), 1062–1071. https://doi.org/10.1038/s41558-018-0315-6
Moss, R. H., Edmonds, J.A., Hibbard, K. A., Manning, M. R., Rose, S. K., van Vuuren, D. P., Carter, T. R., Emori, S., Kainuma, M., Kram, T., Meehl, G. A., Mitchell, J. F., Nakicenovic, N., Riahi, K., Smith, S. J., Stouffer, R. J., Thomson, A. M., Weyant, J. P., Wilbanks, T. J. (2010). The next generation of scenarios for climate change research and assessment. Nature, 463(7282), 747-756. https://doi.org/10.1038/nature08823
Mulhern, O. (2020). Green Walls in an Increasingly Urban World. Earth.Org - Past. Present. Future. Retrieved April 11, 2021, from https://earth.org/data_visualization/green-walls-in-an-increasingly-urban-world/
NASA (2020). NASA, NOAA Analyses Reveal 2019 Second Warmest Year on Record. Earth Science Communications Team at NASA's Jet Propulsion Laboratory, California Institute of Technology. Retrieved on April 15, 2021 from https://climate.nasa.gov/news/2945/nasa-noaa-analyses-reveal-2019-second-warmest-year-on-record/
NASA. (2021). Climate Change: How Do We Know? Earth Science Communications Team at NASA's Jet Propulsion Laboratory, California Institute of TechnologyRetrieved on April 15, 2021 from https://climate.nasa.gov/evidence/
NASEM (2021). The Future of Electric Power in the United States. National Academies of Sciences, Engineering and Medicine, Washington, D.C.: National Academies Press. doi:10.17226/25968
NASEM (2021). Accelerating Decarbonization of the U.S. Energy System, National Academies of Sciences, Engineering, and Medicine: National Academies Press. doi:10.17226/25932.
New Buildings Institute (2018). Making the Transition From Zero Energy to Zero Carbon Building Policies. Retrieved April 11, 2021, from https://newbuildings.org/making-the-transition-from-zero-energy-to-zero-carbon-building-policies/
NOAA (2020). U.S. Billion-dollar Weather and Climate Disasters, 1980 - present. National Oceanic and Atmospheric Administration, National Centers for Environmental Information. Retrieved from https://accession.nodc.noaa.gov/0209268
Ontl, T. A., & Schulte, L. A. (2012). Soil Carbon Storage. Learn Science at Scitable. Retrieved April 11, 2021, from https://www.nature.com/scitable/knowledge/library/soil-carbon-storage-84223790/
Palmer, G. (2020). Greenland Ice Sheet Reached Tipping Point 20 Years Ago, New Study Finds. Columbia Climate School, State of the Planet, GlacierHub Blog. Retrieved April 17, 2021 from https://news.climate.columbia.edu/2020/09/02/greenland-tipping-point-20-years-ago/
Pearson, C. J. (2007). Regenerative, Semiclosed Systems: A Priority for Twenty-First-Century Agriculture. BioScience, 57(5), 409–418. https://doi.org/10.1641
Pozo, C., Galán-Martín, Á., Reiner, D. M., Mac Dowell, N., & Guillén-Gosálbez, G. (2020). Equity in allocating carbon dioxide removal quotas. Nature Climate Change, 10(7), 640–646. https://doi.org/10.1038/s41558-020-0802-4
Project Drawdown (2021). Retrieved April 11, 2021, from https://www.drawdown.org/
Proterra (2021). Public Transit. Retrieved April 10, 2021, from https://www.proterra.com/applications/public-transit/
Province of British Columbia (2021). British Columbia’s Carbon Tax. Retrieved April 10, 2021, from https://www2.gov.bc.ca/gov/content/environment/climate-change/planning-and-action/carbon-tax
Ray, & Douglas (2020). Lazard’s Levelized Cost of Energy Analysis—Version 13.0. Retrieved April 17, 2021 from https://www.lazard.com/media/451419/lazards-levelized-cost-of-energy-version-140.pdf
Reinhart, C. F., Dogan, T., Jakubiec, A., Rakha, T., & Sang, A. (2013). UMI-an Urban Simulation Environment for Building Energy Use, Daylighting and Walkability 2.3. Retrieved from http://www.ibpsa.org/proceedings/BS2013/p_1404.pdf
RGGI (2020). DC Public Works Expands Biodiesel Truck Fleet With Optimus Technologies’ Advanced Fuel Systems. Retrieved April 10, 2021, from https://www.regi.com/blogs/blog-details/resource-library/2020/06/24/dc-public-works-expands-biodiesel-truck-fleet-with-optimus-technologies’-advanced-fuel-systems
RGGI (2021). Retrieved April 10, 2021, from https://www.rggi.org/
Rifkin, J. (2021). Smart Regions Smart Cities: A Digitally Interconnected and Ecologically Sustainable Third Industrial Revolution Across the European Union and China. Retrieved April 11, 2021, from https://www.nrcan.gc.ca/sites/www.nrcan.gc.ca/files/energy/energy-resources/Smart_Regions_Smart_Cities.pdf
Ritchie, H., & Roser, M. (2020c). Environmental impacts of food production, Our World in Data. Retrieved April 11, 2021, from https://ourworldindata.org/environmental-impacts-of-food
Ritchie, H., & Roser, M. (2021). Urban and Rural Population, Our World in Data. Retrieved April 15, 2021, from https://ourworldindata.org/grapher/urban-and-rural-population-2050?country=~OWID_WRL
Ritchie, H., Roser, M. (2019). Who has contributed most to global CO2 emissions? Our World in Data. Retrieved April 15, 2021 from https://ourworldindata.org/contributed-most-global-co2#note-2
Ritchie, H., Roser, M. (2020a). CO2 and Greenhouse Gas Emissions. Our World in Data. Retrieved April 15, 2021 from https://ourworldindata.org/co2-and-other-greenhouse-gas-emissions
Ritchie, H., Roser, M. (2020b). Drivers of Deforestation, Our World in Data. Retrieved from https://ourworldindata.org/drivers-of-deforestation#cutting-down-forests-what-are-the-drivers-of-deforestation
Rogelj, J., Shindell, D., Jiang, K., Fifita, S., Forster, P., Ginzburg, V., Handa, C., Kheshgi, H., Kobayashi, S., Kriegler, E., Mundaca, L., Séférian, R., Vilariño, M.V. (2018). In Mitigation Pathways Compatible with 1.5°C in the Context of Sustainable Development. In: V. Masson-Delmotte, P. Zhai, H.-O. Pörtner, D. Roberts, J. Skea, P.R. Shukla, A. Pirani, W. Moufouma-Okia, C. Péan, R. Pidcock, S. Connors, J.B.R. Matthews, Y. Chen, X. Zhou, M.I. Gomis, E. Lonnoy, T. Maycock, M. Tignor, T. Waterfield, eds., Global Warming of 1.5°C. An IPCC Special Report on the impacts of global warming of 1.5°C above pre-industrial levels and related global greenhouse gas emission pathways, in the context of strengthening the global response to the threat of climate change, sustainable development, and efforts to eradicate poverty. Retrieved from: https://www.ipcc.ch/site/assets/uploads/sites/2/2019/05/SR15_Chapter2_Low_Res.pdf
Romanov, V., Soong, Y., Carney, C., Rush, G., Nielsen, B., & O’Connor, W. (2015). Mineralization of Carbon Dioxide: Literature Review (Program Document). U.S. Department of Energy, Office of Scientific and Technical Information. Retrieved April 11, 2021, from https://www.osti.gov/biblio/1187926
S.1128 - 116th Congress (2019-2020): American Opportunity Carbon Fee Act of 2019. Congress.gov. Library of Congress. Retrieved April 10, 2021, from https://www.congress.gov/bill/116th-congress/senate-bill/1128
S.1183 - 116th Congress (2019-2020): Expanding Access to Sustainable Energy Act of 2019. Congress.gov. Library of Congress. Retrieved April 10, 2021, from https://www.congress.gov/bill/116th-congress/senate-bill/1183/text
S.2284 - 116th Congress (2019-2020): Climate Action Rebate Act of 2019. Congress.gov. Library of Congress. Retrieved April 10, 2021, from https://www.congress.gov/bill/116th-congress/senate-bill/2284
S.3269 - 116th Congress (2019-2020): Clean Economy Act of 2020. Congress.gov. Library of Congress. Retrieved April 9, 2021, from https://www.congress.gov/bill/116th-congress/senate-bill/3269/text?q=%7B%22search%22%3A%5B%22Clean+economy+act%22%5D%7D&r=1&s=3
S.3894 - 116th Congress (2019-2020): Growing Climate Solutions Act of 2020. Congress.gov. Library of Congress. Retrieved April 9, 2021, from https://www.congress.gov/bill/116th-congress/senate-bill/3894/text?q=%7B%22search%22%3A%5B%22Growing+Climate+Solutions+Act%22%5D%7D&r=1&s=2
S.940 - 116th Congress (2019-2020): Healthy Climate and Family Security Act of 2019. Congress.gov. Library of Congress. Retrieved April 10, 2021, from https://www.congress.gov/bill/116th-congress/senate-bill/940
Sachs, J. D. (2001). Tropical Underdevelopment (No. 8119), National Bureau of Economic Research, Cambridge, MA. Retrieved from https://www.nber.org/system/files/working_papers/w8119/w8119.pdf
Saxifrage, B. (2020). Canada’s managed forests have turned into super-emitters, and 2018 set a record. Canada’s National Observer: News & Analysis. #1357 of 1548 Articles from the Special Report: Race Against Climate Change. Retrieved from https://www.nationalobserver.com/2020/06/05/opinion/canadas-managed-forests-have-turned-super-emitters-and-2018-set-record
Schnieders, J., Feist, W., & Rongen, L. (2015). Passive Houses for different climate zones. Energy and Buildings, 105, 71–87. https://doi.org/10.1016/j.enbuild.2015.07.032
Schoell, M. (2019). Making way for coastal wetlands: a look at sea level rise and urban development. Yale Environment Review. Retrieved April 11, 2021, from https://environment-review.yale.edu/making-way-coastal-wetlands-look-sea-level-rise-and-urban-development
Schulman, A. (2020). Pipes or Wires? Rocky Mountain Institute. Retrieved April 11, 2021, from https://rmi.org/pipes-or-wires/
Schwalm, C. R., Glendon, S., & Duffy, P. B. (2020). RCP8.5 tracks cumulative CO2 emissions. Proceedings of the National Academy of Sciences of the United States of America, 117(33), 19656–19657. https://doi.org/10.1073/pnas.2007117117
Shell. (2020). Sustainability Report 2020. Retrieved April 10, 2021, from https://reports.shell.com/sustainability-report/2020/
Sherwood, S. C., Webb, M. J., Annan, J. D., Armour, K. C., Forster, P. M., Hargreaves, J. C., Hegerl, G., Klein, S. A., Marvel, K. D., Rohling, E. J., Watanabe, M., Andrews, T., Braconnot, P., Bretherton C. S. , Foster, G. L., Hausfather, Z., von der Heydt, A. S., Knutti, R., Mauritsen, T., Norris, J. R., Proistosescu, C., Rugenstein, M. G., Schmidt, A., Tokarska, K. B., Zelinka, M. D. (2020). An assessment of Earth's climate sensitivity using multiple lines of evidence. Reviews of Geophysics 58, e2019RG000678. https://doi.org/10.1029/2019RG000678
Shrinkthatfootprint.com (2015). The carbon footprint of 5 diets compared. Retrieved April 11, 2021, from http://shrinkthatfootprint.com/food-carbon-footprint-diet
Slater, T., Hogg, A. E., & Mottram, R. (2020). Ice-sheet losses track high-end sea-level rise projections. Nature Climate Change, 10(10), 879–881. https://doi.org/10.1038/s41558-020-0893-y
Solomon, S., D. Qin, M. M., & Z. Chen, M. Marquis, K.B. Averyt, M. T. and H. L. M. (2007): Summary for Policymakers. Climate Change 2007: The Physical Science Basis. Contribution of Working Group I to the Fourth Assessment Report of the Intergovernmental Panel on Climate Change. Retrieved from https://www.ipcc.ch/site/assets/uploads/2018/02/ar4-wg1-spm-1.pdf
Spitler, J. D., & Southard, L. E. (2014). Performance of the HVAC Systems at the ASHRAE Headquarters Building. Retrieved from www.geoexchange.org
Stiglitz, J. (2019). Addressing Climate Change Through Price and Non-Price Interventions. National Bureau of Economic Research. Working Paper 25939. DOI 10.3386/w25939. Retrieved April 15, 2021 from https://www.nber.org/system/files/working_papers/w25939/w25939.pdf
Tamme, E. (2021). Brief Carbon removal with CCS technologies. Retrieved from https://www.globalccsinstitute.com/wp-content/uploads/2021/02/Carbon-Removal-with-CCS-Technologies.pdf
Torcellini, P. A., Allen, N., & Mcintyre, M. (2020). Plowing through the Cost Barrier: Zero Energy K-12 Schools for Less: Preprint, National Renewable Energy Laboratory. Retrieved April 17, 2021 from https://www.nrel.gov/docs/fy20osti/77414.pdf.
Tschopp, D., Tian, Z., Berberich, M., Fan, J., Perers, B., & Furbo, S. (2020). Large-scale solar thermal systems in leading countries: A review and comparative study of Denmark, China, Germany and Austria. Applied Energy, 270,114997. https://doi.org/10.1016/j.apenergy.2020.114997
UCS (2018). Underwater: Rising Seas, Chronic Floods, and the Implications for US Coastal Real Estate, Union of Concerned Scientists. Retrieved April 17, 2021 from https://www.ucsusa.org/resources/underwater
UCS (2020a). Each Country’s Share of CO2 Emissions, Union of Concerned Scientists.. Retrieved from https://www.ucsusa.org/resources/each-countrys-share-co2-emissions
UCS (2020b). Climate Solutions, Union of Concerned Scientists. Retrieved from https://www.ucsusa.org/climate/solutions
UCS (2021). Fossil Fuels, Union of Concerned Scientists. Retrieved April 10, 2021, from https://www.ucsusa.org/energy/fossil-fuelsUN (1992) A/CONF.151/26/Vol.I: Rio Declaration on Environment and Development. Retrieved from http://www.un.org/documents/ga/conf151/aconf15126-1annex1.htm document retrieved from https://www.un.org/en/development/desa/population/migration/generalassembly/docs/globalcompact/A_CONF.151_26_Vol.I_Declaration.pdf
UNEP (2020a). 2020 Global Status Report for Buildings and Construction, United Nations Environment Program Global Alliance for Buildings and Construction. Retrieved from https://globalabc.org/resources/publications/2020-global-status-report-buildings-and-construction
UNEP (2020b). Letter from the Executive Director, Inger Andersen. United Nations Environment Program, Retrieved on April 15. 2021 from https://wedocs.unep.org/bitstream/handle/20.500.11822/34917/AN2020.pdf?sequence=3&isAllowed=y
UNFCCC (2015). NDC Registry, U.S.A. First NDC Submitted. United Nations Framework Convention on Climate Change, Retrieved on April 15, 2021 from https://www4.unfccc.int/sites/ndcstaging/PublishedDocuments/United States of America First/U.S.A. First NDC Submission.pdf
UNFCCC (2021b). Nationally determined contributions under the Paris Agreement. Synthesis report by the secretariat. United Nations Framework Convention on Climate Change. Retrieved April 13, 2021 from https://unfccc.int/documents/268571
UNFCCC. (2021a) Nationally Determined Contributions (NDCs), United Nations Framework Convention on Climate ChangeRetrieved April 10, 2021, from https://unfccc.int/process-and-meetings/the-paris-agreement/nationally-determined-contributions-ndcs/nationally-determined-contributions-ndcs
US Climate Alliance. (2019). 2019 Fact Sheet. Retrieved April 14, 2021 from https://static1.squarespace.com/static/5a4cfbfe18b27d4da21c9361/t/5f1f0b2cf13e090f828e58dc/1595869997700/USCA+Factsheet_Dec+2019.pdf
US State Department (2021). Joint Statement: The United States and the United Kingdom are Working Together in the Fight Against Climate Change. Retrieved April 11, 2021, from https://www.state.gov/joint-statement-the-united-states-and-the-united-kingdom-are-working-together-in-the-fight-against-climate-change/
USDA Agricultural Marketing Service (2006). Barge Transportation. Retrieved from https://www.ams.usda.gov/sites/default/files/media/RTIReportChapter12.pdf
van Vuuren, D.P., Edmonds, J., Kainuma, M., Riahi, K., Thomson A., Hibbard, K., Hurtt, J.C., Kram, T., Krey, V., Lamarque, J.-F., Masui, T., Meinshausen, M., Nakicenovic, N., Smith, S.J., and Rose, S.K. (2011). The Representative Concentration Pathways: An Overview. Climatic Change, 109(1–2), 5–31. DOI 10.1007/s10584-011-0148-z
Wagner, S. C. (2011). Biological Nitrogen Fixation. Learn Science at Scitable. Retrieved April 11, 2021, from https://www.nature.com/scitable/knowledge/library/biological-nitrogen-fixation-23570419/
Washington Post (2020). University of Sheffield scientists say rock dust could capture carbon. Retrieved April 11, 2021, from https://www.washingtonpost.com/climate-solutions/2020/07/08/spreading-rock-dust-ground-could-pull-carbon-air-researchers-say/
WEF (2020). The European Union is implementing a carbon border fees plan, World Economic Forum. Retrieved April 10, 2021, from https://www.weforum.org/agenda/2020/11/european-union-carbon-border-fees-plan/
Welch, C. (2020). The Grand Old Trees of the World Are Dying, Leaving Forests Younger and Shorter. Retrieved April 11, 2021, from https://www.nationalgeographic.com/science/article/grand-old-trees-are-dying-leaving-forests-younger-shorter
Westerhold, T., Marwan, N., Drury, A. J., Liebrand, D., Agnini, C., Eleni, A., Barnet, J.S.K., Bohaty, S.M., De Vleeschouwer, D. Forindo, F., Frederichs, T., Hodell, D.A., Holbourn, A.E., Holbourn, A.E., Kroon, D., Lauretano, V., Littler, K., Lourens, L.J., Mitchell, L., Heiko, P., Röhl, U., Tian, J., Wilkens, R.H., Wilson, P.A., Zachos, J.C. (2020). An astronomically dated record of Earth’s climate and its predictability over the last 66 million years. Science, 369(6509), 1383–1387. DOI: 10.1126/science.aba6853
WHO (2021). World Health Organization, Climate Change and Health. Retrieved April 16, 2021from https://www.who.int/news-room/fact-sheets/detail/climate-change-and-health
WRI (2020). New Data Shows Millions of People, Trillions in Property at Risk from Flooding — But Infrastructure Investments Now Can Significantly Lower Flood Risk, World Resources Institute. Retrieved April 11, 2021, from https://www.wri.org/news/2020/04/release-new-data-shows-millions-people-trillions-property-risk-flooding-infrastructure
WRI (2021). Global Forest Review, World Resources Institute. Retrieved April 5, 2021, from https://research.wri.org/gfr
Xu, C., Kohler, T. A., Lenton, T. M., Svenning, J.-C., & Scheffer, M. (2020). Future of the human climate niche. Proceedings of the National Academy of Sciences, 117(21), 11350–11355. https://doi.org/10.1073/pnas.1910114117
Zizzo, R., Kyriasis, J., & Goodland, H. (2017) Embodied Carbon of Buildings and Infrastructure, Forestry Innovation Investment. Retrieved from https://c40.my.salesforce.com/sfc/p/#36000001Enhz/a/1Q000000MfBT/DDTlbqgxtorp23za23K5GH3EwMhVz39fZTVCVF4O180